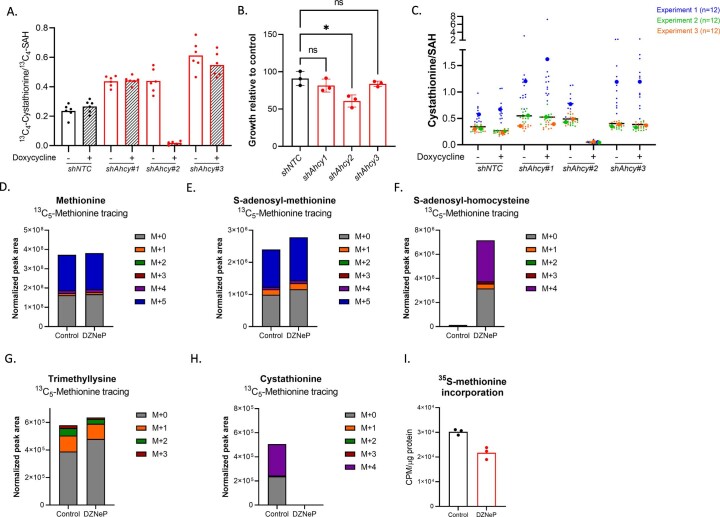
Extended Data Fig. 7. Genetic silencing of Ahcy, 13C-methionine tracing and 35S-protein incorporation in APC organoids.
(A) Knockdown validation assay (seeding density 5,000 cells) showing that genetic silencing of Ahcy in APC organoids was efficient for shAhcy#2 as indicated by a reduced ratio of 13C4-Cystathionine/13C4-SAH. Bar indicates Mean. Data from a single experiment. Each dot represents a technical replicate (n = 6 per condition). (B) Quantification of APC organoid growth showing growth inhibition for shAhcy#2 (seeding density 2,000 cells, growth quantified with Syto 60 Nucleic Acid Stain and represented as relative to doxycycline-free culture condition). Mean ± SD; each dot represents the mean of 3 independent experiments with 12 technical replicates per condition; asterisk refers to p-value obtained from Kruskal-Wallis test followed by Dunn’s correction (shNTC vs shAhcy1: p = 0.9245; shNTC vs shAhcy2: p = 0.0276; shNTC vs shAhcy3: p > 0.9999). (C) Metabolomics accompanying growth assays represented in panel B showing efficient Ahcy knockdown for shAhcy#2 as indicated by a reduced ratio of Cystathionine/SAH. Data shown for 3 independent experiments. Small dots represent technical replicates (n = 12 per condition). Large dots represent the averages for each independent experiment. (D-H) Plots accompanying Fig. 4(D-H) showing the abundance of all isotopologues for (D) methionine, (E) SAM, (F) SAH, (G) trimethyllysine, and (H) cystathionine in APC organoids (+/- DZNeP 1 μM) cultured in the presence of 13C5-methionine. Data from a representative experiment performed twice, with 4 technical replicates each. Bars show mean. (I) 35S-methionine protein incorporation assay performed with APC organoids (+/- DZNeP 1 μM). Data from a representative experiment performed twice, with 3 technical replicates each (shown). Bars show mean.

