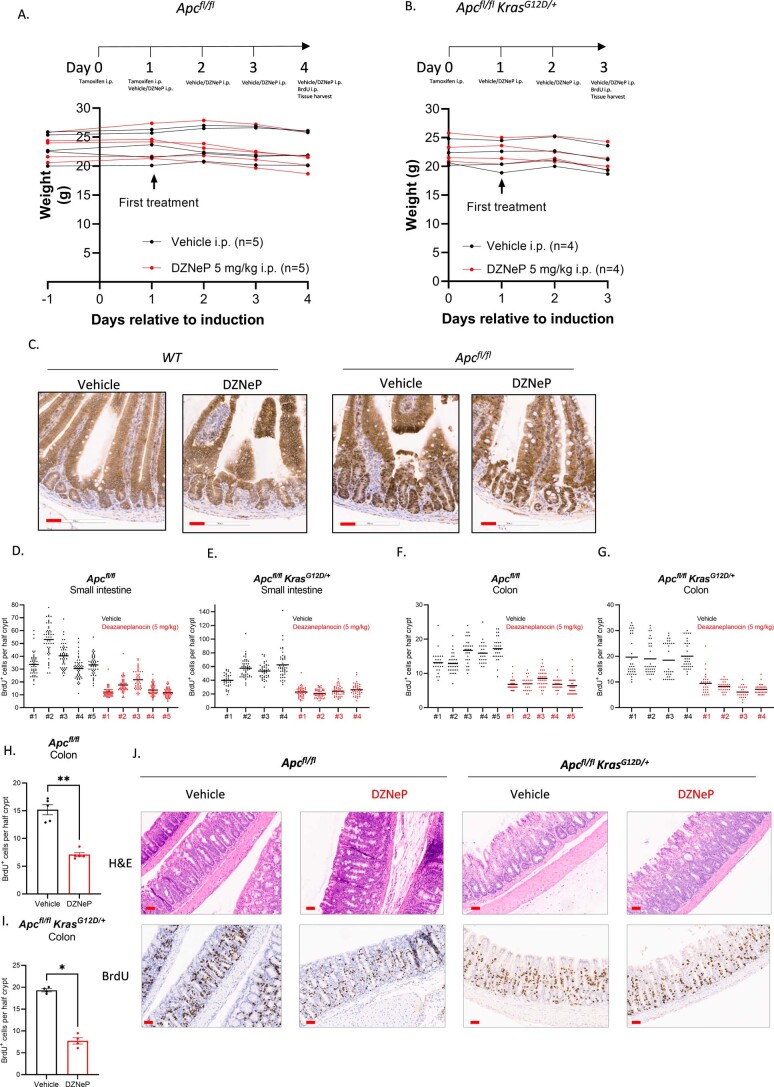
Extended Data Fig. 8. Effects of DZNEP on β-catenin localization and intestinal proliferation in APC and APC KRAS mice.
(A,B) Schematic representation of experiments performed to test the effect of DZNeP in APC and APC KRAS mice, and the effect of daily treatment for 4 days or 3 days for APC and APC KRAS mice, respectively on body weight. (C) Representative images of IHC for β-catenin in the small intestine of WT (n = 3) and APC (n = 5) animals treated with vehicle or DZNeP (5 mg/kg). Scale bars (red): 50 μm. (D-G) Quantification of IHC for BrdU incorporation in the (D,E) small intestine and (F,G) colon of APC and APC KRAS mice treated with vehicle or DZNeP (5 mg/kg). [n = 5 (APC) or n = 4 (APC KRAS) mice per experimental arm]; Individual data shown for each mouse. Line represents mean. Each dot represents the number of BrdU positive cells counted per half crypt. (H,I) Quantification of IHC for BrdU in the colon of APC and APC KRAS mice treated with vehicle or DZNeP (5 mg/kg). [n = 5 (APC) or n = 4 (APC KRAS) mice per experimental arm]; Mean ± SEM. Each dot represents the average number of BrdU positive cells per half crypt for each mouse. Asterisks refer to p-values obtained from 1-tailed unpaired Mann-Whitney tests (*: p = 0.0143; **: p = 0.0040). (J) Representative images of H&E staining and IHC for BrdU on colon sections of APC (n = 5) and APC KRAS (n = 4) mice treated with vehicle or DZNeP (5 mg/kg). Scale bars: 50 μm.

