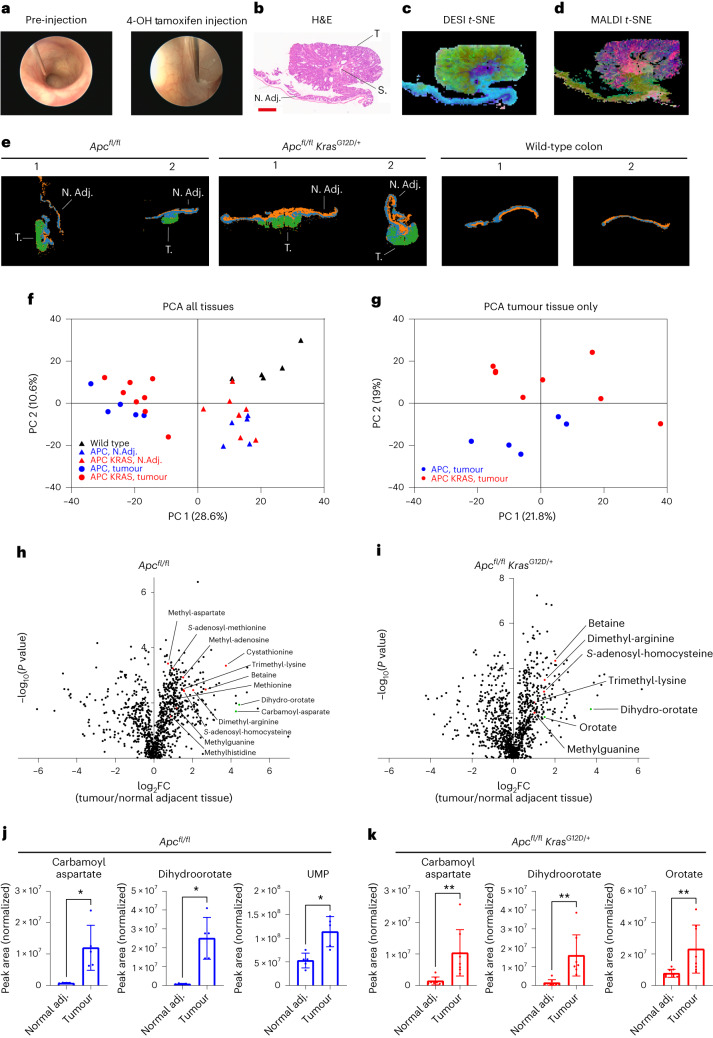
Fig. 2. Metabolic profiling of genetically engineered mouse models of APC-deficient CRC using MSI and LC–MS.
a, Representative images of endoscopy-guided submucosal delivery of 4-OH-tamoxifen in the mouse colon resulting in localized genetic recombination and tumour formation. b, Representative image of H&E-stained distal colon tissue with an Apc-deficient tumour. N. Adj., normal adjacent tissue; S, stroma; T, tumour tissue. Tissues analysed for n = 4 mice; n = 1 shown. Scale bar, 1 mm. c,d, t-SNE plot of data acquired by DESI-MSI (negative polarity) (c) and MALDI-MSI (negative polarity) (d) of distal colon tissue of locally induced APC mice (tissues analysed for n = 4 animals; n = 1 shown). e, k-means plots of data acquired by DESI-MSI (positive polarity) of distal colon tissue of locally induced APC (n = 5) and APC KRAS (n = 7) mice, and normal colon from WT (n = 4) mice (n = 2 mice per group shown). f, PCA of untargeted LC–MS data (1,322 features) acquired on polar extracts of normal adjacent and colon tumour tissues of APC (n = 5) and APC KRAS (n = 8) mice, and control colon of WT (n = 5) mice. g, PCA of untargeted LC–MS data acquired on polar extracts of tumour tissues of APC (n = 5) and APC KRAS (n = 8) mice. h,i, Volcano plots showing metabolic differences between paired normal adjacent and colon tumour tissues of APC (n = 5) or APC KRAS (n = 8) mice as detected by untargeted LC–MS (P values obtained from paired t-tests). All annotated metabolites: fold change ≥ 1.5 and significant after Benjamini–Hochberg false discovery rate (FDR) correction (q = 0.05). Red dots indicate metabolites related to methionine metabolism; green dots indicate intermediates of de novo pyrimidine biosynthesis. j,k, Plots showing normalized abundances (mean ± s.d.) of intermediates of de novo pyrimidine synthesis in tumour and normal adjacent colon tissue of APC (n = 5 mice) and APC KRAS (n = 8 mice) mice (targeted analysis of LC–MS data). Each dot represents an individual mouse. Asterisks refer to P values obtained from one-tailed Wilcoxon matched-pairs signed-rank tests (*P = 0.0313; **P = 0.0039).

