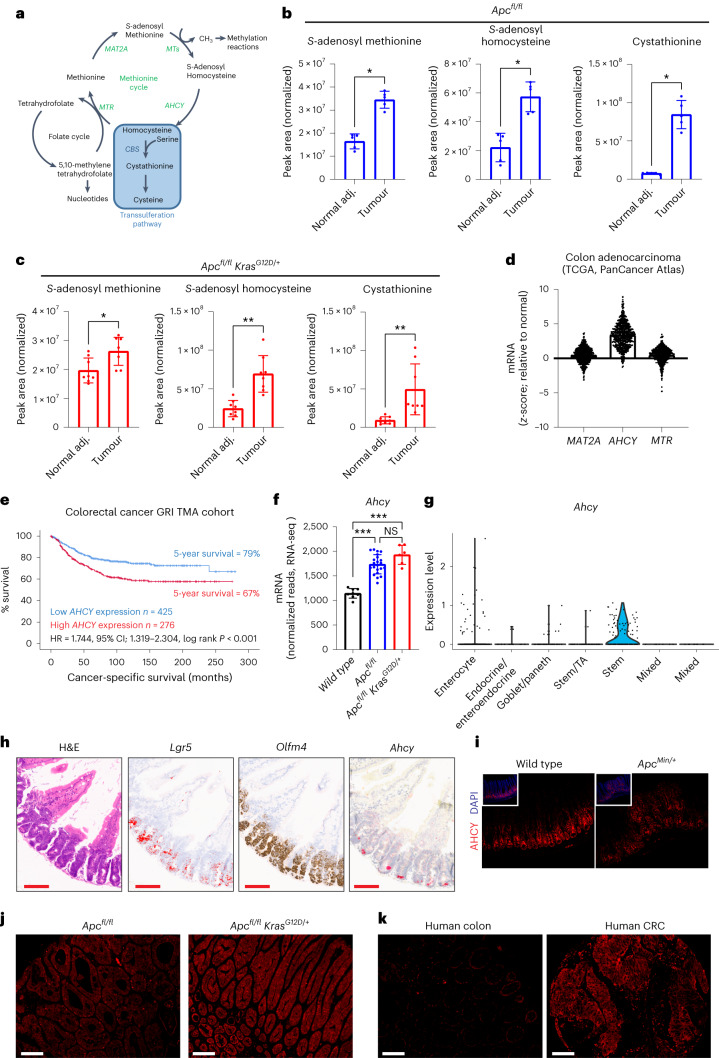
Fig. 3. Methionine cycle activity and AHCY expression in human colorectal cancer and genetically engineered mouse models of colorectal cancer.
a, Schematic representation of the methionine and folate cycle, and transsulferation pathway. b, Plots showing normalized abundances (mean ± s.d.) of SAM, SAH and cystathionine in tumour and normal adjacent colon tissue of APC mice (n = 5) as detected by targeted analysis of LC–MS data. Each dot represents an individual mouse. Asterisks refer to P values obtained from one-tailed Wilcoxon matched-pairs signed-rank tests (*P = 0.0313). c, Plots showing normalized abundances (mean ± s.d.) of SAM, SAH and cystathionine in tumour and normal adjacent colon tissue of APC KRAS (n = 8) mice as detected by targeted analysis of LC–MS data. Each dot represents an individual mouse. Asterisks refer to P values obtained from one-tailed Wilcoxon matched-pairs signed-rank tests (*P = 0.0273; **P = 0.0039). d, Expression of genes encoding enzymes of the methionine cycle in human colorectal adenocarcinoma (n = 592 individuals) compared with normal colon (TCGA, PanCancer Atlas; https://www.cbioportal.org/). Each dot shows the expression level for an individual. e, Cancer-specific survival analysis in the context of tumour epithelial AHCY expression in individuals with CRC (GRI TMA cohort, n = 701). f, Ahcy expression (mean ± s.d.) in the small intestine of WT (n = 8), APC (n = 22) and APC KRAS (n = 6) mice. Each dot represents an individual mouse. Asterisks represent P values obtained from Kruskal–Wallis test followed by Dunn’s correction (***P < 0.001: WT versus APC, P = 0.0004; WT versus APC KRAS, P = 0.0001; APC versus APC KRAS, P = 0.5054). g, Ahcy expression across the different cell populations of the small intestinal epithelium in APC mice (n = 2), as determined by scRNA-seq. h, H&E-stained and representative images of ISH for Olfm4, Lgr5 and Ahcy in the small intestine of APC mice. (Tissues analysed for n = 4; n = 1 shown). Scale bar, 100 µm. Images for Lgr5 were processed using ImageJ to show ISH staining in red. i–k, IF showing AHCY protein expression in the small intestine of WT and ApcMin/+ mice (tissue analysed for n = 2 WT and n = 3 ApcMin/+ mice; i), APC and APC KRAS tumours (tissues analysed for n = 3 animals; n = 1 shown; j), and normal human colon and human CRC (image derived from single patient sample, from a set of 49 samples analysed; k). Scale bars, 100 µm.

