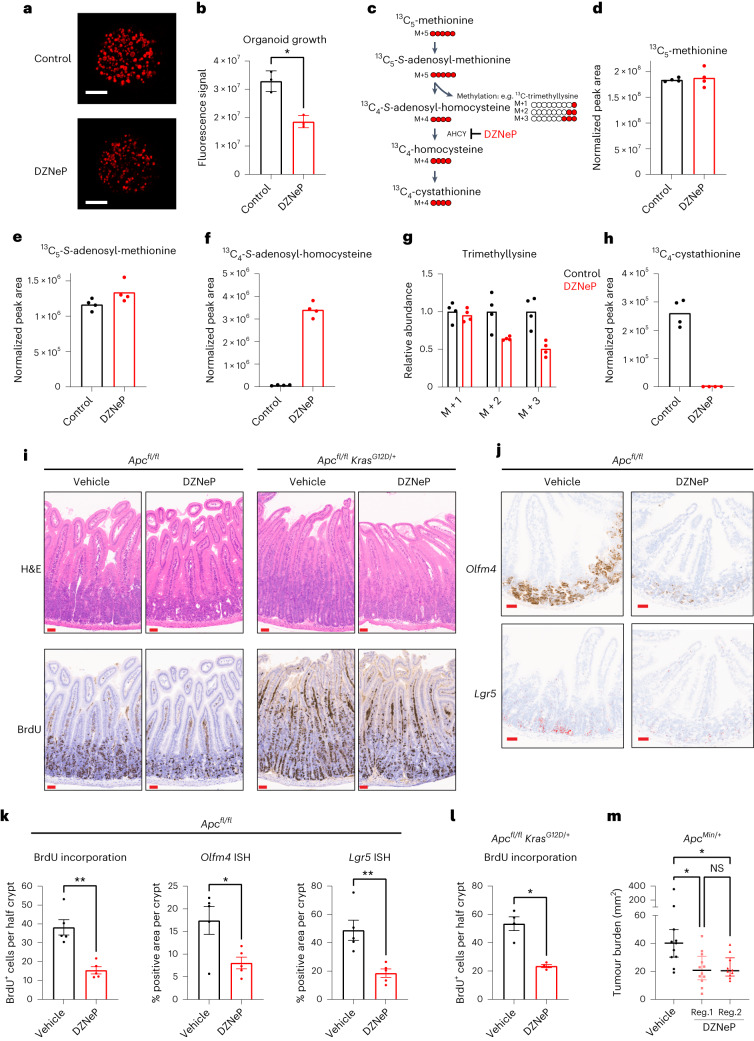
Fig. 4. Inhibition of AHCY suppresses proliferation, stem cell expansion and tumorigenesis in APC-driven models of colorectal cancer.
a,b, Representative images (scale bar, 250 µm; a) and quantification (b) of APC organoids (±DZNeP 1 μM) stained with Syto 60 nucleic acid stain (mean ± s.d.; each dot represents the mean of three independent experiments with 4 or 5 technical replicates each). Asterisk refers to P value obtained from one-tailed Mann–Whitney test (*P = 0.05). c, Schematic showing carbon contribution of 13C5-methionine to intermediates of the methionine cycle, cystathionine and trimethyllysine. d–h, Abundance of 13C5-methionine (d), 13C5-SAM (e), 13C4-SAH (f), various isotopologues of trimethyllysine (g) and 13C4-cystathionine (h) in APC organoids (±DZNeP 1 μM; bar indicates the mean; data from a representative experiment performed twice, with four technical replicates each; each dot represents a technical replicate). i, Representative images of H&E staining and IHC for BrdU on small intestinal sections of APC (n = 5) and APC KRAS (n = 4) mice treated with vehicle or DZNeP (5 mg per kg body weight). Scale bars, 50 μm; j, Representative images of ISH for Olfm4 and Lgr5 expression in the small intestine of APC mice (n = 5) treated with vehicle or DZNeP (5 mg per kg body weight). Scale bars, 50 μm. Images for Lgr5 were processed using ImageJ to show ISH staining in red. k,l, Quantification of IHC for BrdU in the small intestine of APC and APC KRAS mice treated with vehicle or DZNeP (5 mg per kg body weight). Mean ± s.e.m.; n = 5 (APC) or n = 4 (APC KRAS) mice per experimental arm; each dot represents the average number of BrdU-positive cells per half crypt for each mouse), and ISH for Olfm4 and Lgr5 in APC mice treated with vehicle or DZNeP (5 mg per kg body weight). Mean ± s.e.m., n = 5 APC mice per experimental arm; each dot represents the average percentage of positive area Olfm4 or Lgr5 per crypt for each mouse. Asterisks refer to P values obtained from one-tailed Mann–Whitney tests: k, *P = 0.0476; **P = 0.0040; l, *P = 0.0143. m, Small intestinal macroscopic tumour burden in ApcMin/+ mice treated with vehicle or DZNeP from day 50 until day 85 of age. Vehicle (n = 11): i.p. PBS. Regime 1: DZNeP (2 mg per kg body weight i.p.; n = 12) using weekly cycles of 4 d of daily treatment followed by 3 d of no treatment. Regime 2: DZNeP (5 mg per kg body weight i.p.; n = 10) twice per week. Plot shows the median with interquartile range. Each dot represents an individual mouse. Asterisks represent P values obtained from Kruskal–Wallis test followed by Dunn’s correction (*P < 0.05; vehicle versus reg.1: P = 0.0114; vehicle versus reg.2: P = 0.0243; reg.1 versus reg.2: P > 0.999).

