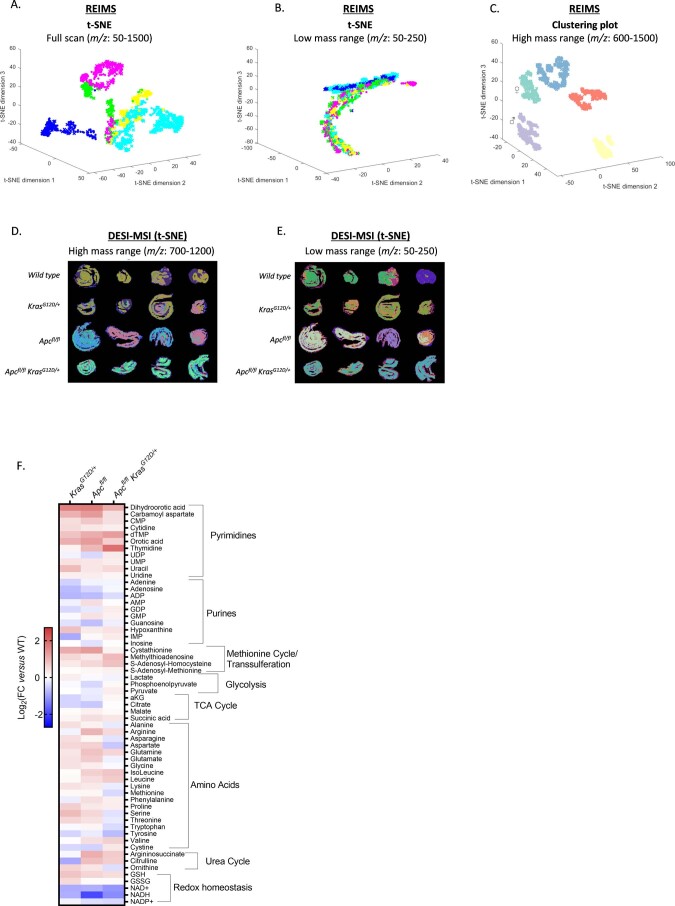
Extended Data Fig. 1. Metabolic profiling of intestinal tissues by REIMS, DESI-MSI and LC-MS.
(A) Multivariate analysis of REIMS data showing segmentation when focusing analysis on the full acquired mass range (m/z = 50-1500), or (B) low mass range (m/z: 50-250). Colour coding: yellow = WT; green = KRAS; cyan = APC; pink = APC KRAS; blue = APC KRAS PTEN. Each dot corresponds to a single mass spectrum acquired using the REIMS forceps. Data acquired from WT (n = 3), KRAS (n = 4) APC (n = 11), APC KRAS (n = 4), and APC KRAS PTEN (n = 5) mice. (C) Clustering plot of REIMS data (m/z: 600-1500) showing genotype-dependent clustering. ♂/♀ indicate male/female dominant APC clusters. (D) t-SNE of DESI-MSI data acquired from longitudinal sections of the rolled up small intestine of WT, KRAS, APC, and APC KRAS mice focusing analysis on ions within high mass range m/z: 700-1200, or (E) low mass range m/z: 50-250 (n = 4 per genotype, each image is a rolled small intestine from one individual mouse). (F) Targeted LC-MS analysis of polar extracts of colonic tissues from KRAS, APC, and APC KRAS mice compared with WT mice. Heatmap constructed based on fold change between the averages of each experimental group (n = 3).

