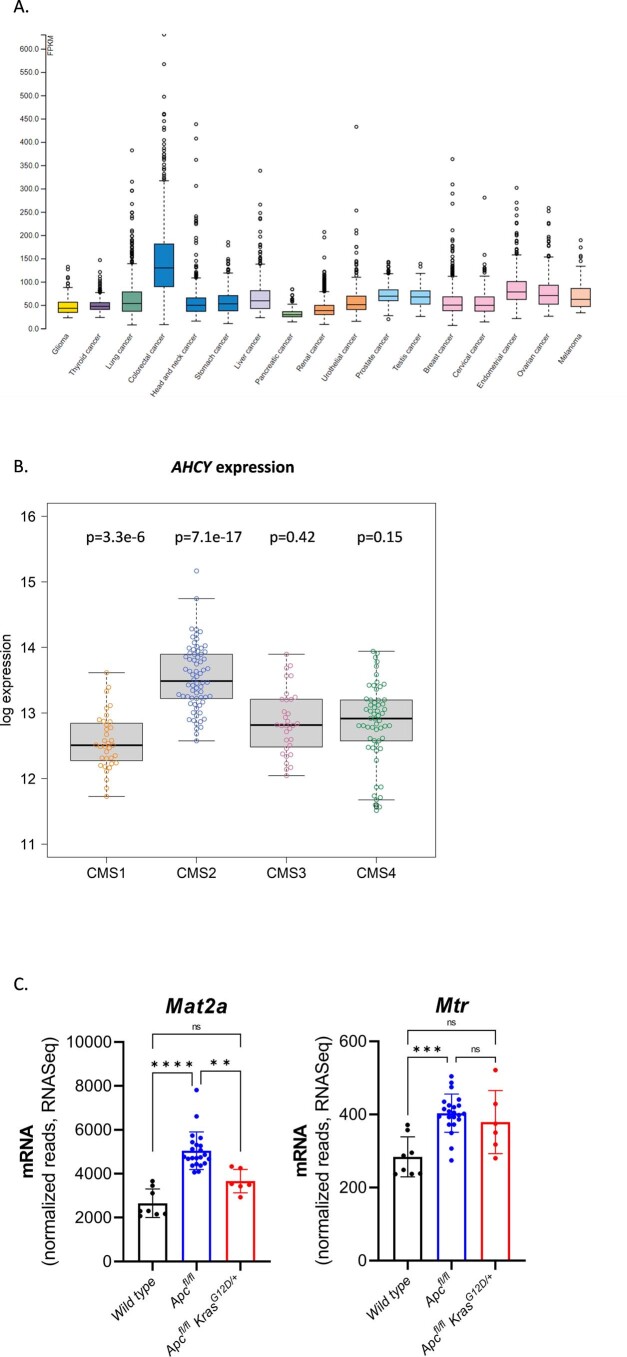
Extended Data Fig. 5. Expression of methionine cycle enzymes in human cancers and CRC GEMMs.
(A) Pan-cancer analysis showing AHCY gene expression in 17 cancers as analysed by RNA-Seq. Data reported as FPKM (number fragments per kilobase of exon per million reads), generated by The Cancer Genome Atlas (TCGA). Image credit: Human Protein Atlas, image available from v22.proteinatlas.org18. Sample numbers for each cancer type are available at URL: https://www.proteinatlas.org/ENSG00000101444-AHCY/pathology Box plots show median, and 25th and 75th percentiles. Points are displayed as outliers if they are above or below 1.5 times the interquartile range. Minima, Maxima and n number are shown in ‘Source Data’. (B) Expression of AHCY across the different consensus molecular subtypes of human CRC19. Box plots show median, and 25th and 75th percentiles. Whiskers for boxplots are 1.5x the interquartile range. p-values refer to difference between each CMS group relative to all others. Two-sided p-values were calculated by fitting a linear model, computing moderated t-statistics and then correcting for multiple testing using the Benjamini-Hochberg method. Minima, Maxima and n number are shown in ‘Source Data’. (C) Mat2a and Mtr expression (Mean ± SD) in the small intestine of WT (n = 8), APC (n = 22) and APC KRAS (n = 6) mice. Each dot represents an individual mouse, asterisks represent p-values obtained from Kruskal-Wallis test followed by Dunn’s correction [(Mat2a: WT vs APC: p < 0.0001; WT vs APC KRAS: p = 0.9685; APC vs APC KRAS: p = 0.0095), (Mtr: WT vs APC: p = 0.0005; WT vs APC KRAS: p = 0.1048; APC vs APC KRAS: p > 0.9999)].

