Fig. 4.
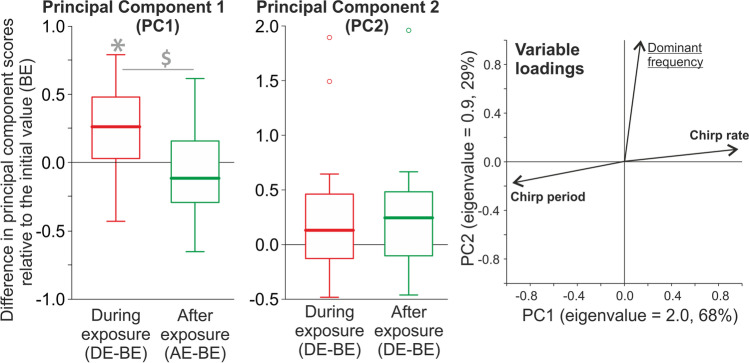
Effect of the electromagnetic field on the male cricket calling song. Right panel: dimension reduction with the principal component analysis (PCA). Eigenvalues (variances explained by particular principal components, PC1 and 2) are reported with percentages of the total variance explained as axis labels. Variable loadings (correlations of the measured variables with particular components) are shown as vectors; variables labelled with bold or underlined font strongly contributed (absolute loading values > 0.5) to PC1 and 2, respectively. The PCA extracted two principal components: PC1 (associated with the chirp rate and negatively correlated with the chirp period) and PC2 (associated with the dominant signal frequency). The PC1 and PC2 scores were obtained for animals before (BE), during (DE), and after (AE) their exposure to EMF. The PC1 and PC2 scores are presented in the left and middle panels, respectively, as differences relative to the initial values (i.e., DE-BE and AE-BE, respectively). Asterisks indicate significant differences between BE and the later periods, and the dollar marks indicate differences between DE and AE. Values above and below 0 indicate an increase and decrease in the PC score compared to initial (BE) values, respectively. The boxplots present medians (horizontal lines), 1st–3rd quartiles (boxes), 1.5*interquartile range (whiskers), and outliers (circles). Raw data for particular signal parameters are shown in Fig. S2)

