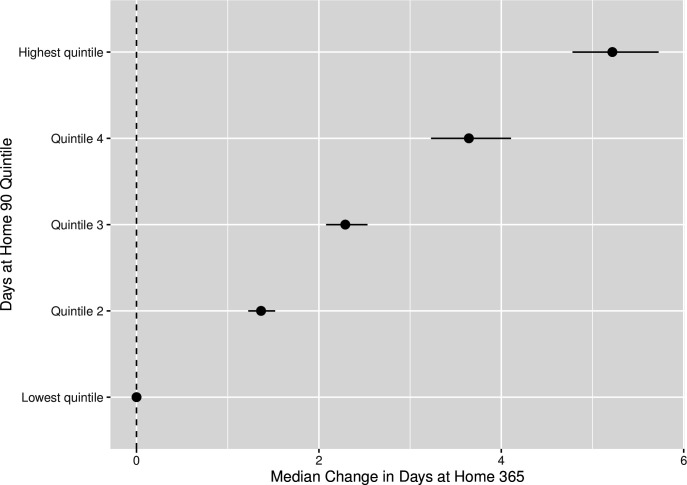
Figure 3.
The forest plot depicts the median adjusted difference in days alive at home in the 365 days after hip fracture admission and the associated 95% credible intervals (based on the highest probability density interval from the posterior distribution) among patients with hip fracture who survived 90 days after admission, with the quintile of days alive at home in 90 days as the predictor.

