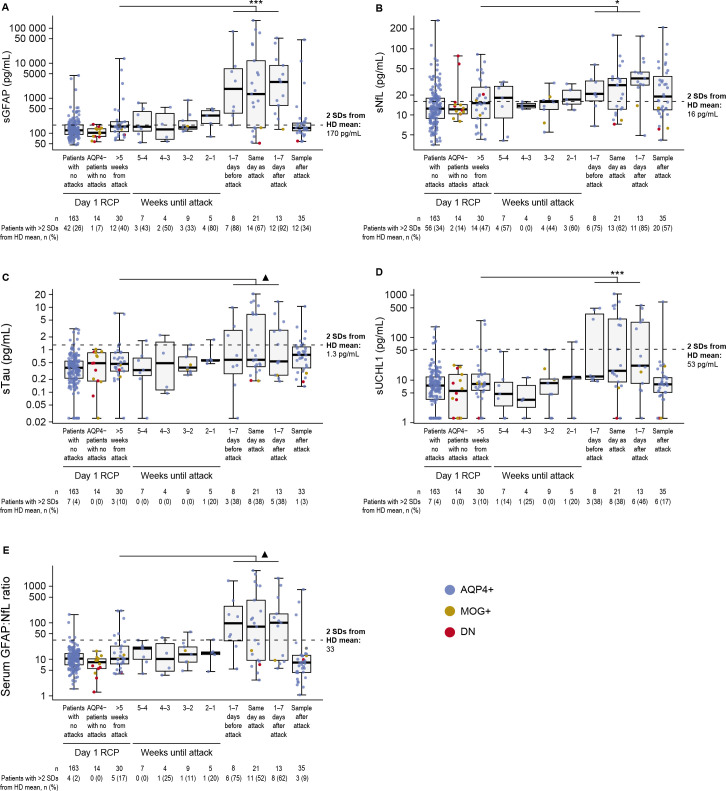
Figure 1.
Boxplots displaying (A) sGFAP, (B) sNfL, (C) sTau, (D) sUCHL1 and (E) serum GFAP:NfL ratio in samples drawn during the lead-up to an NMOSD attack and in day1/RCP samples drawn >5 weeks from the attack in participants who experienced an NMOSD attack during the RCP. Horizontal dotted lines show 2 SDs from the mean of the HD control cohort; sGFAP, 170 pg/mL; sNfL, 16 pg/mL; sTau, 1.3 pg/mL; sUCHL1, 53 pg/mL; sGFAP:sNfL ratio, 33. Note the differing y-axis scales, particularly the logarithmic scale for sGFAP. Median (IQR) attack follow-up was at 108 (27–124) days. ▲p<0.10; *p<0.05; **p<0.01; ***p<0.001, Wilcoxon signed-rank test, samples drawn at baseline versus 1 week until attack. AQP4+, seropositive for immunoglobulin G autoantibodies to aquaporin-4; AQP4−, seronegative for immunoglobulin G autoantibodies to aquaporin-4; DN, double-negative; GFAP, glial fibrillary acidic protein; HD, healthy donor; MOG+, seropositive for myelin oligodendrocyte glycoprotein-immunoglobulin G; NfL, neurofilament light chain; NMOSD, neuromyelitis optica spectrum disorder; RCP, randomised controlled period; sGFAP, serum glial fibrillary acidic protein; sNfL, serum neurofilament light chain; sTau, serum tau; sUCHL1, serum ubiquitin C-terminal hydrolase L1.

