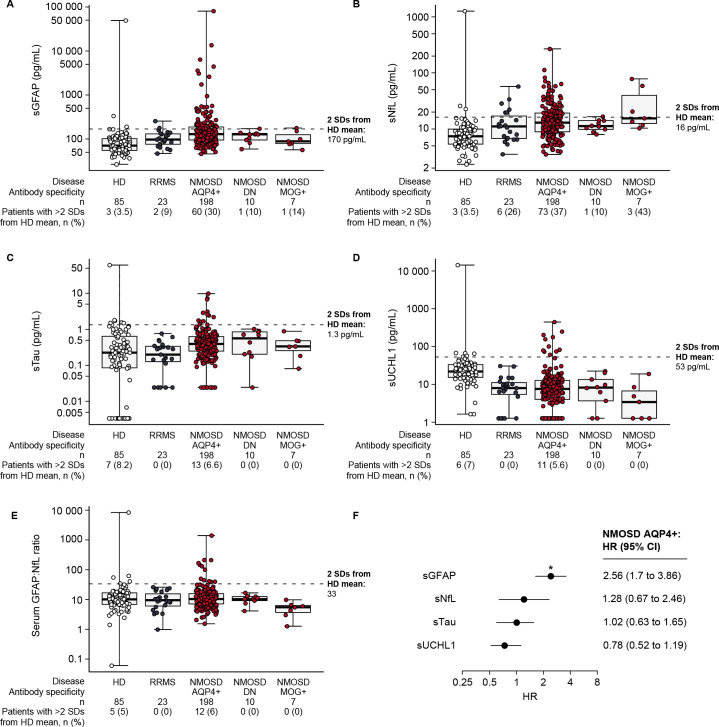
Figure 2.
Boxplots of day 1/RCP serum CNS damage biomarkers relative to HDs. (A) sGFAP, (B) sNfL, (C) sTau, (D) sUCHL1 and (E) serum GFAP:NfL ratio. Patients were determined to be ‘high’ for each cut-off based on levels being higher than two SDs from the mean of the HD cohort. Horizontal dotted line in each case represents the threshold for 2 SDs from the HD mean; sGFAP, 170 pg/mL; sNfL, 16 pg/mL; sTau, 1.3 pg/mL; sUCHL1, 53 pg/mL; sGFAP:sNfL ratio, 33. (F) Forest plot of Cox regression coefficients from model fit using day 1/RCP CNS damage biomarker concentrations as predictors of RCP attack risk in AQP4+ participants. Note the differing logarithmic y-axis scales, particularly the scale for sGFAP. HR for sGFAP, *p<0.05. AB, antibody; AQP4+, seropositive for immunoglobulin G autoantibodies to aquaporin-4; CNS, central nervous system; DN, double-negative; GFAP, glial fibrillary acidic protein; HD, healthy donor; MOG+, seropositive for myelin oligodendrocyte glycoprotein-immunoglobulin G; NfL, neurofilament light chain; NMOSD, neuromyelitis optica spectrum disorder; RCP, randomised controlled period; RRMS, relapsing–remitting multiple sclerosis; sGFAP, serum glial fibrillary acidic protein; sNfL, serum neurofilament light chain; sTau, serum tau; sUCHL1, serum ubiquitin C-terminal hydrolase L1.

