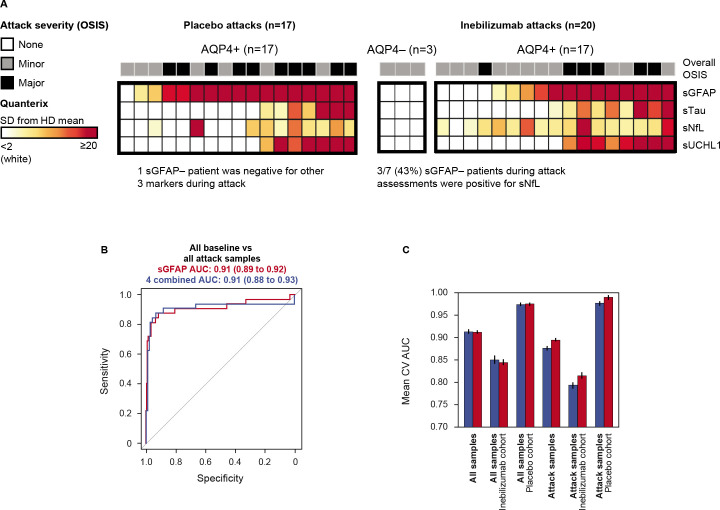
Figure 3.
(A) Heatmap displaying concentration of CNS damage markers relative to HD reference cohort in samples drawn most proximal (+/− 7 days) to NMOSD attack in placebo-treated participants (left) and inebilizumab-treated participants (right). Heatmaps ordered by sGFAP concentration. (B) Mean ROC curves for out-of-fold predictions from 10 iterations of fivefold cross validation for mixed-effect logistic regression model fit to identify 37 attack samples versus remaining samples drawn during the study using sGFAP alone (red) versus all four CNS markers (blue) as predictors. (C) Sensitivity analysis displaying mean (+/− SEM) AUC from out-of-fold predictions for both models for all samples, samples drawn from the inebilizumab cohort and placebo cohort separately, then for those samples drawn from participants who experienced attacks during the RCP. One participant had a missing attack sample. AQP4+, seropositive for immunoglobulin G autoantibodies to aquaporin-4; AQP4−, seronegative for immunoglobulin G autoantibodies to aquaporin-4; AUC, area under the curve; CNS, central nervous system; CV, coefficient of variation; HD, healthy donor; NMOSD, neuromyelitis optica spectrum disorder; OSIS, Opticospinal Impairment Scale; RCP, randomised controlled period; ROC, receiver operator curve; sGFAP, serum glial fibrillary acidic protein; sNfL, serum neurofilament light chain; sTau, serum tau; sUCHL1, serum ubiquitin C-terminal hydrolase L1.

