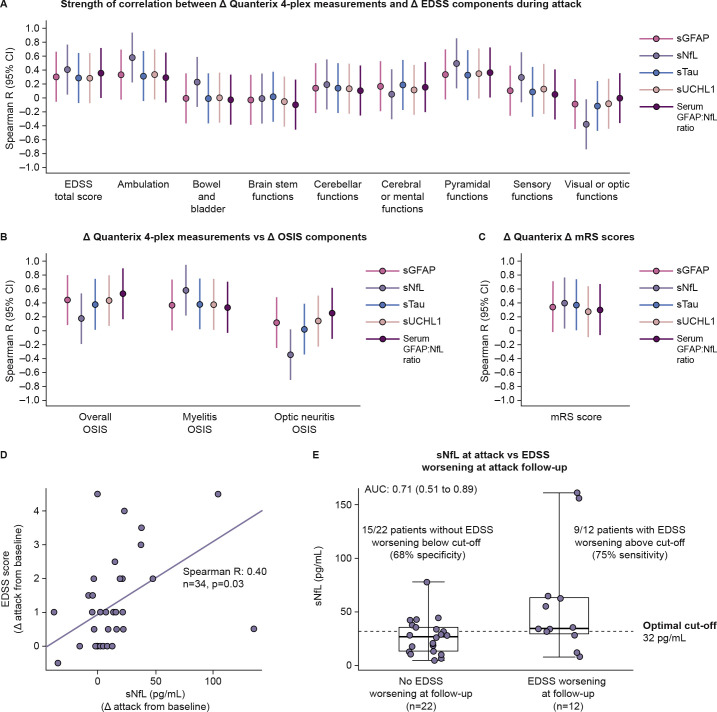
Figure 4.
(A-C) Forest plots displaying strength of correlation between change from baseline in concentration of CNS damage biomarkers and change from baseline in (A) EDSS component scores, (B) the OSIS components scores and (C) mRS scores in AQP4+ participants. (D) Scatterplot displaying correlation between changes from baseline to attack in sNfL and EDSS scores during attack assessments. (E) Box and whisker plot displaying distribution of sNfL changes from baseline in participants who displayed EDSS score worsening at attack follow-up versus those who did not experience EDSS score change at follow-up. Optimal cut-off point determined using Youden’s index. Attack follow-up was (median (±IQR)) 108 (27–124) days. AUC, area under the curve; CNS, central nervous system; EDSS, Expanded Disability Status Scale; GFAP, glial fibrillary acidic protein; mRS, modified Rankin Scale; OSIS, Opticospinal Impairment Scale; sGFAP, serum glial fibrillary acidic protein; sNfL, serum neurofilament light chain; sTau, serum tau; sUCHL1, serum ubiquitin C-terminal hydrolase L1.

