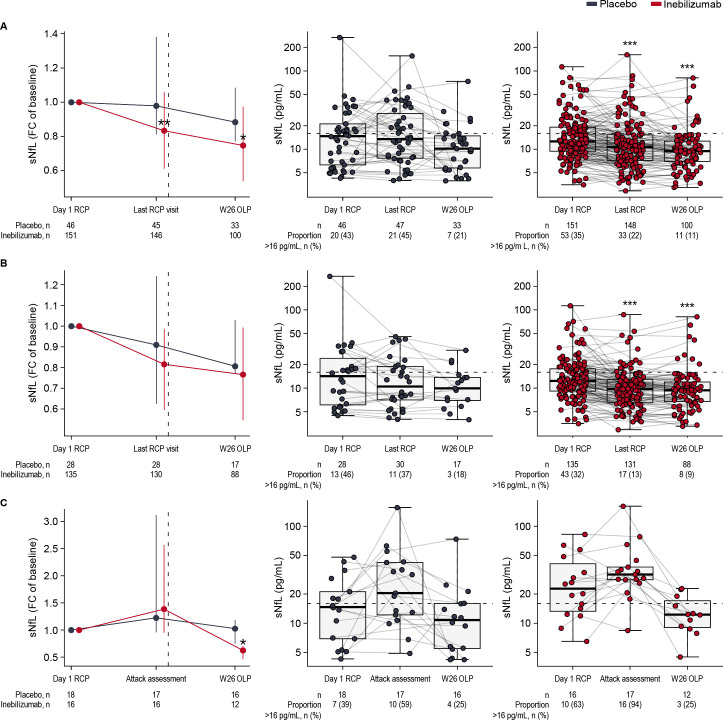
Figure 5.
(A) Median (+/− IQR) fold change from baseline of sNfL in inebilizumab-treated and placebo-treated participants. Significance of changes between treatment groups assessed using Mann-Whitney U test. Boxplots of sNfL concentrations in (B) participants who did not experience RCP attacks and (C) those who did experience RCP attacks. Dashed vertical lines show when all participants received inebilizumab therapy at the end of the RCP and start of the OLP. Dashed horizontal lines show the threshold for elevated sNfL concentrations. Significance of changes from baseline in each treatment group was assessed using the Wilcoxon-signed rank test; *p<0.05; **p<0.01; ***p<0.001. FC, fold change; OLP, open-label period; RCP, randomised controlled period; sNfL, serum neurofilament light chain; W, week.

