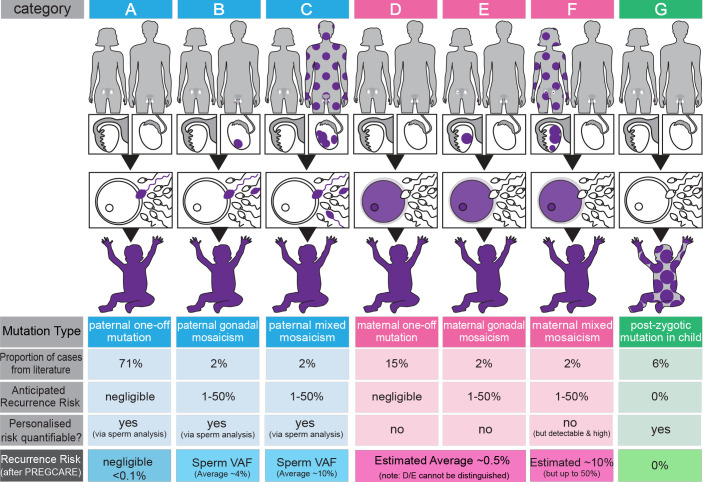
Figure 1.
Overview of the PREcision Genetic Counselling And REproduction (PREGCARE) strategy and stratification of de novo mutation (DNM) recurrence risk into seven different categories. By establishing the origin (paternal (blue), maternal (pink) or postzygotic (proband, green)) and the timing of the mutational events (purple colour indicates mutant cells), it is possible to stratify individual families into different categories that are associated with widely different recurrence risks (see ‘anticipated recurrence risk’ in the figure). The proportion of cases in each category can be estimated using data from the literature. Four of the seven categories (ie, categories B, C, F and G) involve mosaic presentations and can be identified by deep sequencing of the collected tissues from the family trio. Furthermore, analysis of a sperm sample for paternal cases allows direct quantification of the risk to another pregnancy (ie, variant allele frequency (VAF) of the DNM in the semen sample). By singling out these mosaic families, the remaining (mosaic-negative by deep sequencing) categories (A, D, E) have a reduced risk of recurrence estimated to be ~0.1% (>10-fold reduction over the generic 1%–2% risk) (see Bernkopf et al 2 for details). The last row of the figure represents an overview of the refinement of risk generated during the PREGCARE strategy. Analysis of the DNM parental origin via long-read sequencing allows to further refine the risk for the mosaic-negative categories and reassure the majority of families, as category A (one-off paternal, 71% of cases) is associated with a negligible risk, estimated to be below 0.1% depending on the exact limit of detection for the specific custom assay; note that categories D and E cannot be distinguished from one another because it is not possible to access maternal oocytes and the risk for a DNM of proven maternal origin is estimated to be reduced modestly (~2×–8×) compared with the population with generic risk. Likewise, the risk associated with category F (mixed maternal mosaicism) cannot be quantified but is likely to be ‘high’ and can be estimated to be on average ~10% (for further details and references, see Bernkopf et al 2). Figure adapted from Bernkopf et al.2

