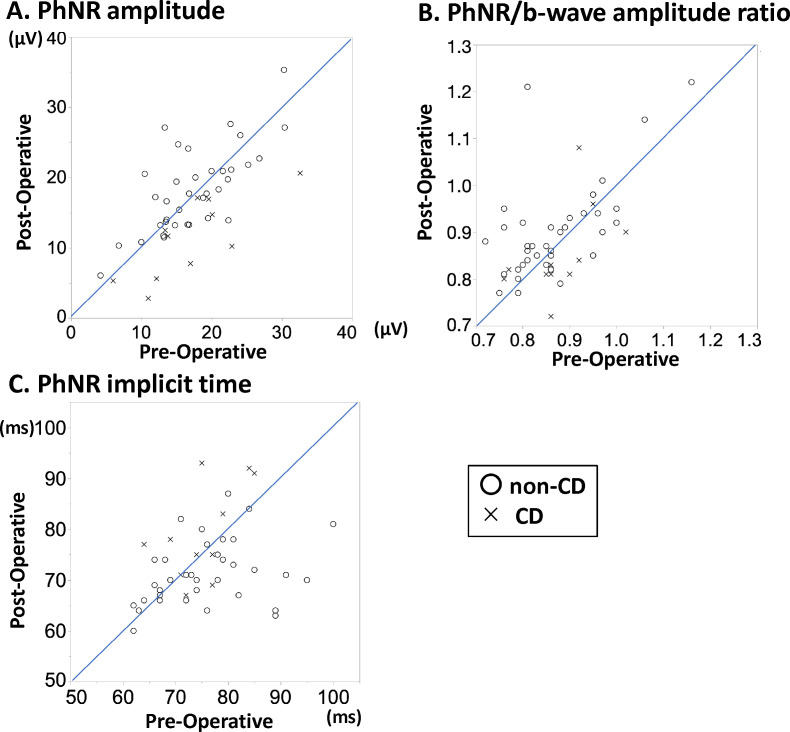
Figure 4.
Scatter plots showing the change in PhNR implicit time and amplitude and the PhNR/b-wave amplitude ratio. Scatter plots of each PhNR parameter pre -and postoperatively. The x-axis shows the preoperative values, and the y-axis shows the postoperative values. In the plot, the circle indicates the non-CD group and the cross indicates the CD group. (A) PhNR amplitude. (B) PhNR/b-wave amplitude ratio. (C) PhNR implicit time. CD, choroidal detachment; PhNR, photopic negative response.

