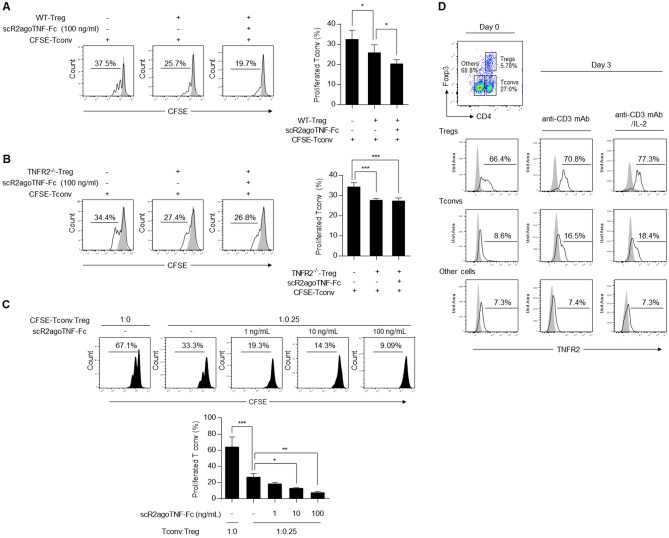
Figure 4.
Ex vivo suppressive activity of Tregs expanded by scR2agoTNF-Fc. (A) WT-Tregs and (B) TNFR2−/−Treg suppression assays were performed using pre-expanded Tregs. WT-CD4+CD25+ Tregs and TNFR2−/−CD4+CD25+ Tregs were expanded by scR2agoTNF-Fc (100 ng/ml) for 72 h. Then, each Treg population was cultured with CFSE-labeled CD4+CD25− Tconvs for another 72 h. CFSE division was measured by FCM. Data are the mean ± SD (n = 4). (C) A Treg suppression assay was performed under the conditions where CD4+CD25+ Tregs and CFSE-labeled CD4+CD25− Tconvs were co-incubated. A mixture of Tregs, CFSE-Tconvs, and APC-containing 90.2− cells were cultured and stimulated by scR2agoTNF-Fc (0, 1, 10, 100 ng/ml) for 72 h. Then, CFSE division was measured by FCM. Data are the mean ± SD (n = 4). (D) LN cells were stimulated with immobilized anti-mouse CD3 mAb and soluble recombinant IL-2 (10 U/ml). Then, TNFR2 expression levels of the activated T cell subsets, CD4+CD25+ Tregs, CD4+CD25− Tconvs, and CD4−CD25− cells, were measured. *p < 0.05, **p < 0.01, ***p < 0.001 (one-way ANOVA with Turkey multiple comparison test).

