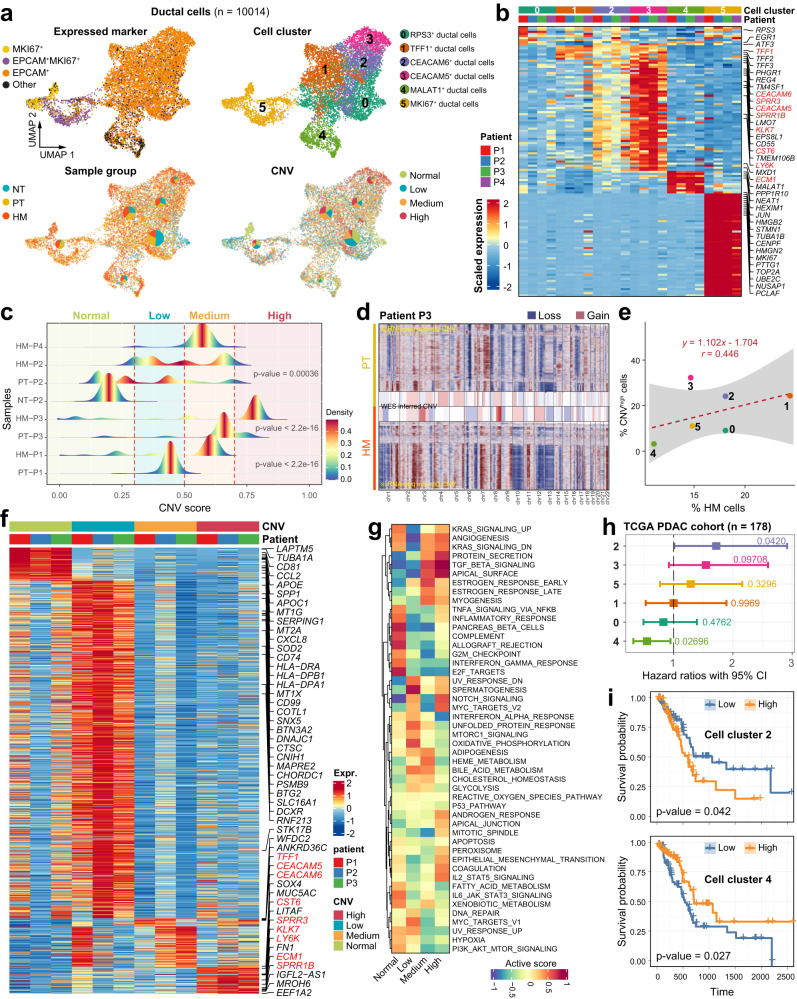
Fig. 2. Transcriptional signatures and CNV heterogeneity of ductal cells.
a UMAPs showing the distribution of ductal cells expressing the indicated maker genes (top left), ductal cell subtypes (n = 6; top right), the percentage of cells from different sample groups (bottom left) or at different CNV levels (bottom right) for each subcluster. b Heatmap showing the expression of marker genes in the six ductal cell subtypes. Selected marker genes are highlighted. c Ductal cells are grouped into different categories based on CNV score. Joyplots show the distribution of CNV score in different samples. Dashed lines in red indicate the threshold values. d CNV inferred by scRNA-seq and whole-exome sequencing (WES) data in patient P3. e The percentage of cells from HM samples is positively correlated with the proportion of cells with high level of CNVs. Fitted line and standard errors with 95% confidence intervals are shown. f Heatmap showing the scaled expression level of differentially expressed genes among cells with different CNV levels. Genes highlighted in red are also subtype-specific as shown in (b). g Heatmap showing functional pathways activated in cells with different CNV levels using GSVA analysis. h Association of relative cell abundance (estimated by CIBERSORTx) and patient survival using the TCGA PDAC cohort (n = 178) by COX regression analysis. The p value is calculated with two-sided log-rank test. i Kaplan–Meier curves of TCGA PDAC patients (n = 178) showing the survival rates grouped by the cell abundance in ductal cell clusters 2 and 4. The p value is calculated with two-sided log-rank test.

