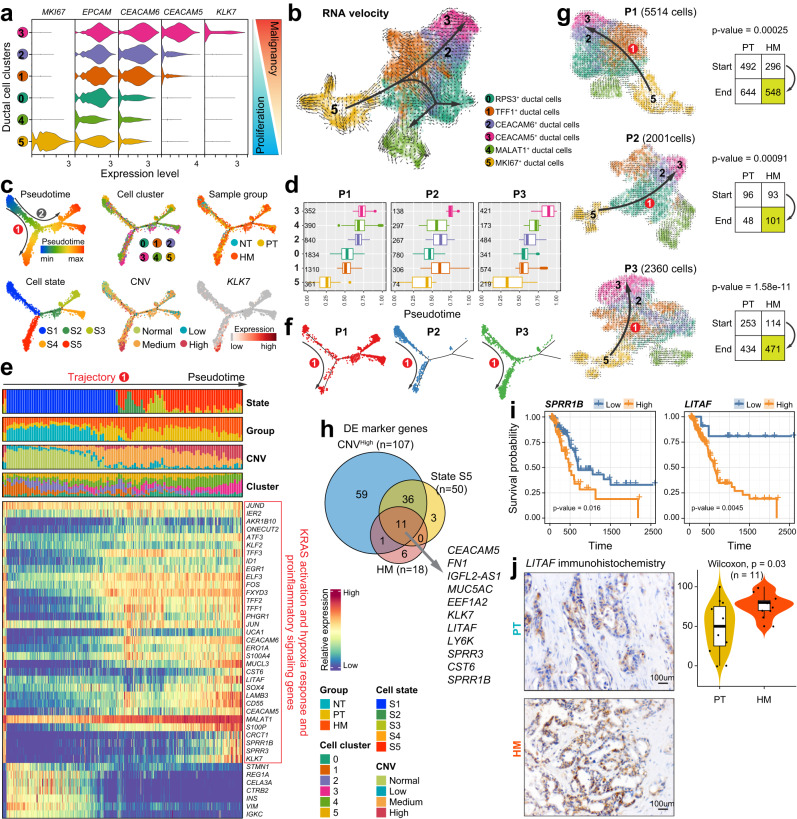
Fig. 3. Pseudotime trajectory analysis reveals diverse ductal cell differentiation states.
a Violin plots displaying the expression of representative genes associated with PDAC proliferation or malignancy across ductal cell subtypes. Color key from blue to red indicates relative marker genes expression pattern from proliferation to malignancy. b Unsupervised pseudotime trajectory of ductal cell subtypes by RNA velocity. Arrowhead direction represents the trend of cell pseudo-temporal differentiation. c Semisupervised pseudotime trajectory of ductal cell subtypes inferred by Monocle2. Trajectory is colored by pseudotime (top left), cell states (bottom left), cell subtypes (top middle), CNV levels (bottom middle), sample groups (top right) and the expression dynamics of a selected marker gene KLK7 (bottom right). d Boxplot showing the latent time of ductal cell subtypes by RNA velocity in patients P1–P3. The number of cells in each category is indicated in the left of boxplot. The boxes showing the median (horizontal line), second to third quartiles (box), and Tukey-style whiskers (beyond the box). e Heatmap showing the scaled expression of differentially expressed genes across pseudotime trajectory in (c). Bar plots at the top of the heatmap are scale diagrams of different cell states, sample groups, CNV levels and cell subtypes during pseudotime differentiation trajectory. f Distribution of ductal cells along the Monocle2-estimated trajectories for patients P1–P3. g RNA velocity analysis of ductal cells for each patient (P1–P3). Arrowhead direction represents a conserved differentiation trajectory (from ductal cell subtype 5 to subtypes 2 and 3) among the patients. The number of ductal cells in PT and HM from the start subtype (cluster 5) and end subtypes (clusters 2 and 3) of the conserved trajectory (route 1) is shown on the right. The p value was calculated using the χ2 test. h Venn diagrams showing the overlap of the DEGs in high level CNV, cell state S5, and HM ductal cells. i Kaplan–Meier curves of patients in the TCGA PDAC cohorts (n = 178). The p value was calculated using the two-sided log-rank test. j Immunohistochemistry analysis (left) of LITAF expression in PT and HM groups. Violin plots (right) displaying immunohistochemical scores across the patients (n = 11). Scale bars, 100 μm. The boxes indicate the median (horizontal line), second to third quartiles (box), and Tukey-style whiskers (beyond the box). The error bar indicates standard error of the mean (s.e.m.). The p value is calculated with one-sided Wilcoxon rank-sum test.

