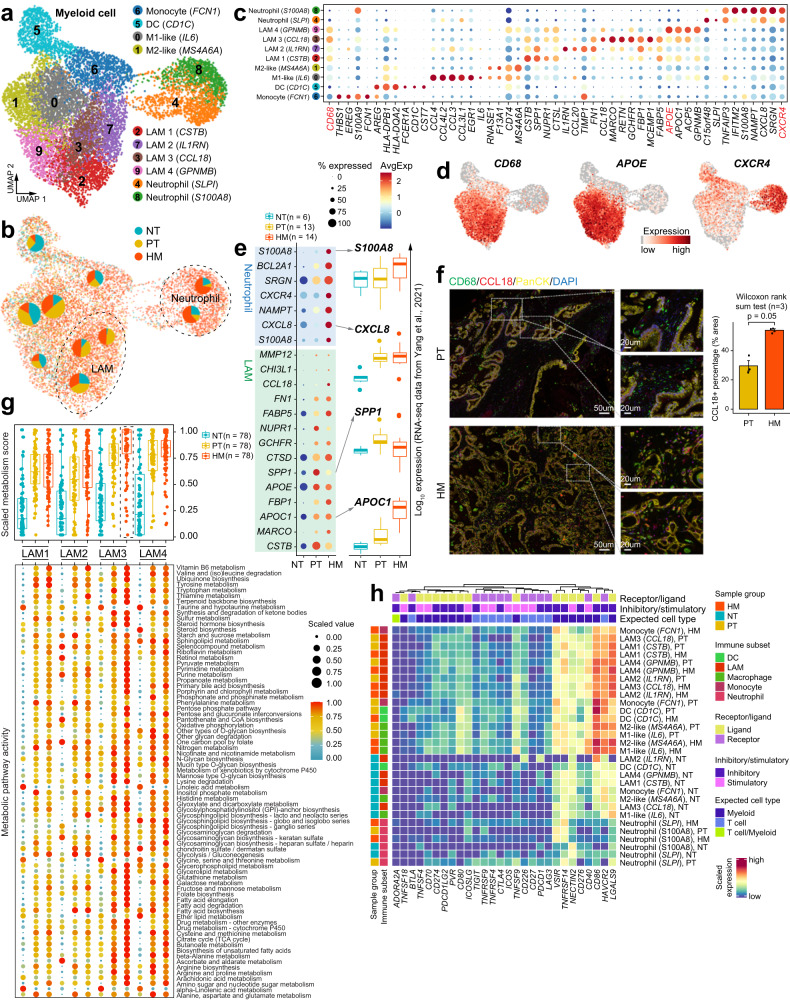
Fig. 5. Transcriptional landscape of myeloid cells in the tumor microenvironment of primary tumor and liver metastasis tissues.
a UMAP showing the subtypes of myeloid cells, colored by subtypes. b Distribution of myeloid cells in different sample groups on the UMAP. Pie chart showing the proportion of three sample groups in each cell subcluster. c Dot plot illustrating the average expression and frequency of representative marker genes in each myeloid cell subcluster. d Feature plots showing the expression of selected cluster-specific genes. Cells with the highest expression level are colored red. e Dot plot illustrating DEGs in neutrophils and Lipid-associated macrophages (LAMs) from three sample groups (left). Boxplots showing the expression patterns of S100A8, CXCL8, SPP1, and APOC1 using the bulk RNA-seq dataset from Yang et al.12. The number of samples in each group is in the legend. The boxes showing the median (horizontal line), second to third quartiles (box), and Tukey-style whiskers (beyond the box). f Immunofluorescent staining showing co-localization of CD68 (green), CCL18 (red), PanCK (yellow), and DAPI (blue) in PT and HM samples. Scale bars, 50 μm (left) and 20 μm (right). The bar plots show the quantification results, n = 3 patients with paired PT and HM samples. The error bar indicates standard error of the mean (s.e.m.). The p value is calculated with one-sided Wilcoxon rank-sum test. g Boxplot (top) showing the metabolic score of metabolic pathways in four LAM subclusters (LAM1-LAM4). The points indicate individual pathways (n = 76). Dot plot (bottom) showing the metabolic activity analysis of all LAM subclusters by scMetabolism. The circle size and color darkness both represent the scaled metabolic score. The number of pathways in each category is indicated below the boxplot. The boxes showing the median (horizontal line), second to third quartiles (box), and Tukey-style whiskers (beyond the box). h Heatmap showing the scaled expression levels of a series of immune checkpoint genes in myeloid cell subtypes. Subtypes are grouped by sample source and myeloid cell type annotations (DC, LAM, macrophage, monocyte and neutrophil). Genes are grouped as receptor or ligand, inhibitory or stimulatory status and expected major lineage cell types known to express the gene (lymphocyte and myeloid).

