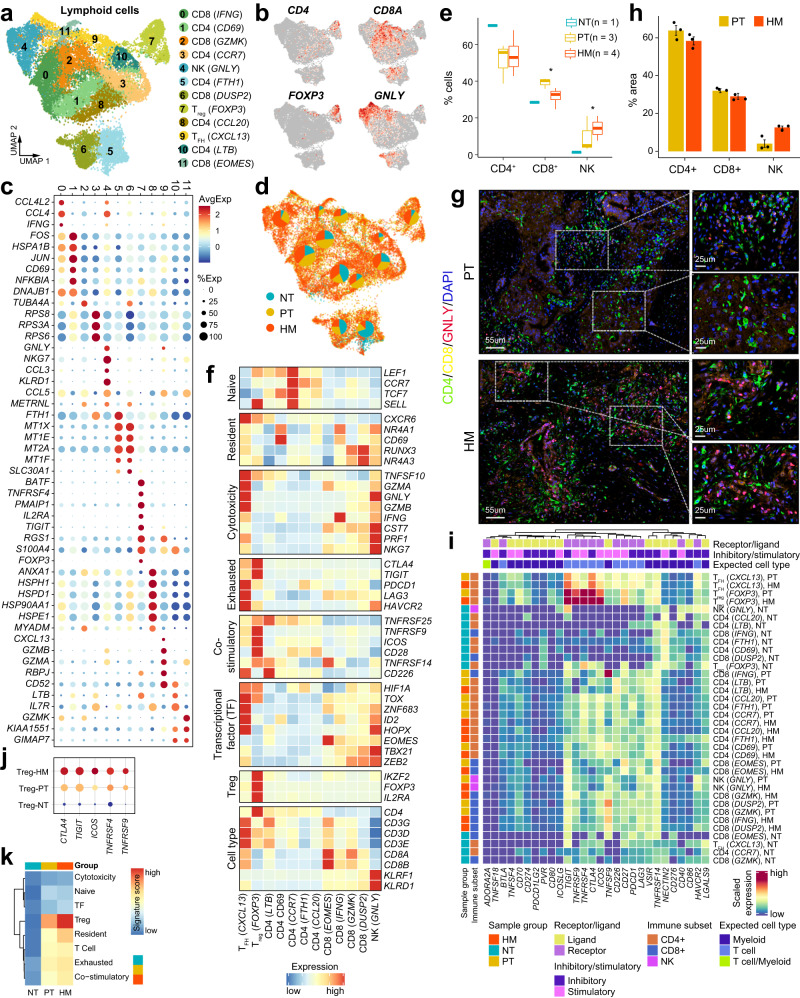
Fig. 6. Transcriptional landscape of lymphoid cells in the tumor microenvironment of primary tumor and liver metastasis tissues.
a UMAP projection of subclustered lymphoid cells, labeled in different colors. b Feature plots showing the expression of selected cluster-specific genes. Cells with the highest expression level are colored red. c Dot plot illustrating the average expression and frequency of representative marker genes in the subclusters of lymphoid cells. d Distribution of lymphoid cells in different sample groups on the UMAP. Pie chart showing the proportion of three sample groups in each cell subcluster. e Boxplot indicating the proportion CD4+ T, CD8+ T and NK cells in three sample groups (NT; n = 1, PT; n = 3, HM; n = 4). The boxes showing the median (horizontal line), second to third quartiles (box), and Tukey-style whiskers (beyond the box). The p value is calculated using one-sided Wilcoxon rank-sum test. *p < 0.05. f Heatmap indicating the expression of selected gene sets, including naive, resident, cytotoxicity, exhausted, co-stimulatory, transcriptional factors (TF), and cell type, in each lymphoid cell subcluster. g Immunofluorescent staining showing co-localization of CD4 (green), CD8 (yellow), GNLY (red), and DAPI (blue) in PT and HM samples (n = 3). Scale bars, 55 μm (left) and 25 μm (right). h The bar plots show the quantification results from g, n = 3 patients with paired PT and HM samples. The error bar indicates standard error of the mean (s.e.m.). i Heatmap showing the scaled expression levels of a series of immune checkpoint genes in subtypes of lymphoid cells. Subtypes are grouped by sample source and lymphocyte cell type annotations (CD4+ T, CD8+ T, and NK cell). Genes are grouped by receptor or ligand, inhibitory or stimulatory status and expected major lineage cell types known to express the gene (lymphocyte and myeloid). j Dot plot illustrating the expression levels of five checkpoint genes (CTLA4, TIGIT, ICOS, TNFRSF4, and TNFRSF9) in regulatory T cells from three sample groups. k Heatmap indicating the expression of selected gene sets, including cytotoxicity, naive, transcriptional factors (TF), resident, cell type, exhausted, and co-stimulatory, in regulatory T cells from three sample groups.

