Figure 2.
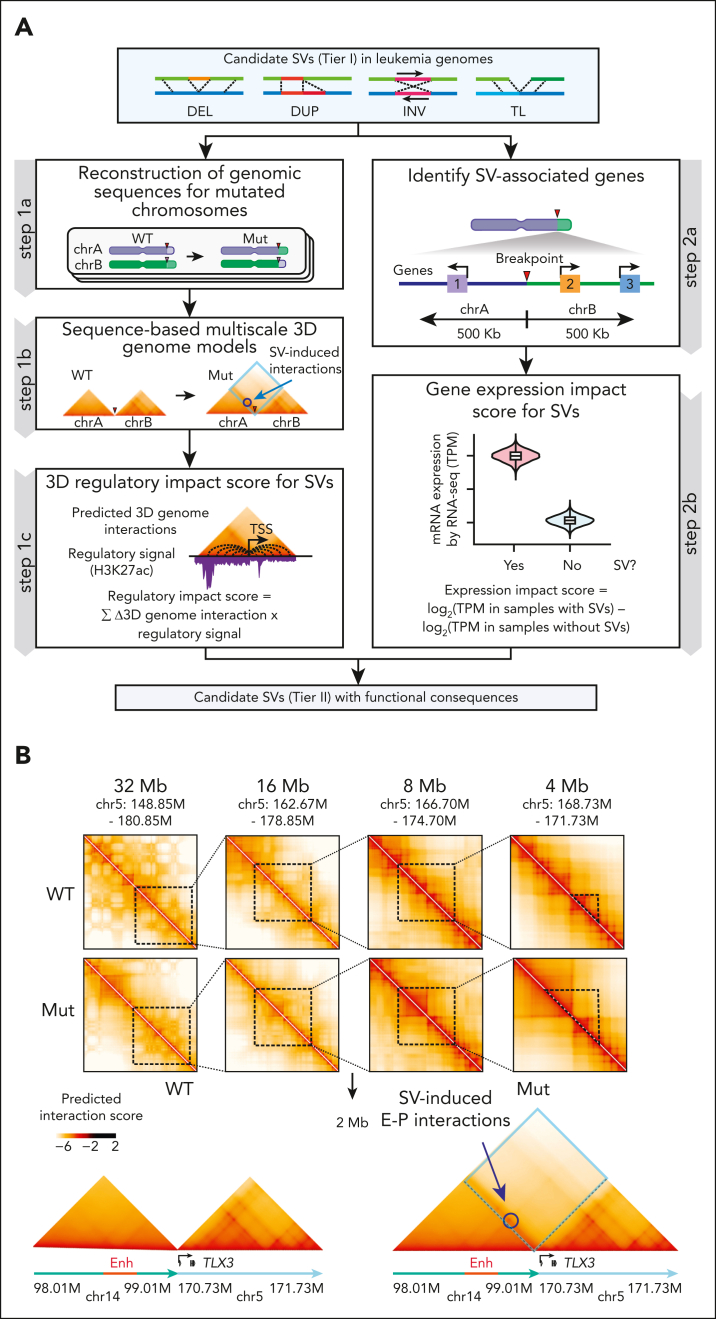
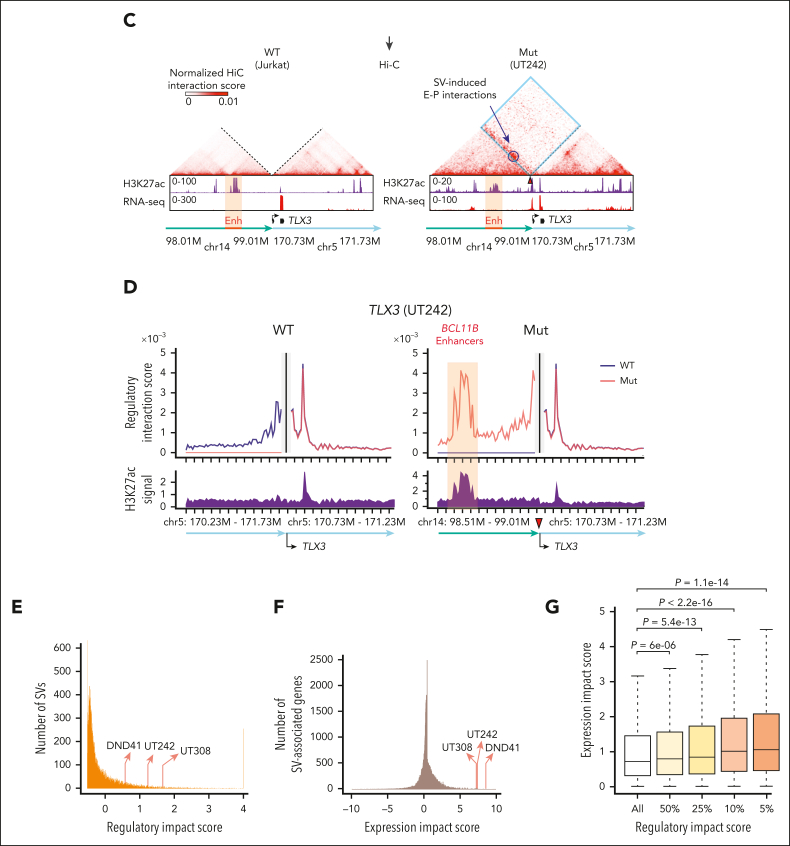
Identification of SVs with functional consequences. (A) Schematic overview of identifying tier II SVs with functional consequences. For each SV, the regulatory impact score was derived from modeling 3D genome interactions using Orca14 trained in 3 separate modes for AML, T-ALL, and B-ALL, whereas the gene expression impact score was calculated by comparing normalized RNA-seq expression values for genes within 500 kb of chromosomal break point and compared between samples containing an SV against other samples without the SV. (B) Predicted SV-induced 3D genome interactions for t(5;14) in UT242. Contact matrices for chr5 (WT) and t(5;14) TL alleles (Mut) at 4 to 32 Mb scale resolutions are shown. The 2 Mb t(5;14) contact matrices are centered on the chromosomal break point for UT242. Annotated enhancers on chr14 are denoted by red box. Predicted gain of E-P interactions are circled. (C) Hi-C contact matrices within 2 Mb window centered on the UT242 chromosomal break point. Hi-C contact map for Jurkat cells is shown as the WT control. H3K27ac ChIP-seq and RNA-seq signals for each sample are shown below. Hi-C contacts within dotted blue lines indicate ectopic interactions induced by t(5;14). (D) The predicted 3D regulatory interaction scores (y-axis) for the TLX3 promoter within a 2 Mb window (x-axis) in UT242. Black vertical lines indicate the TLX3 transcription start site. Scores for WT and SV (Mut) alleles are shown in the left and right panels, respectively. The predicted gain of interactions at the BCL11B enhancers on chr14 is shown by orange highlights. Arrowheads indicate chromosomal break points. Coordinates correspond to hg19 genome assembly. (E) Distribution of the regulatory impact scores for each SV. The rankings of t(5;14)-containing samples are indicated by arrows. (F) Distribution of the expression impact scores for SV-associated genes. (G) SV expression impact scores correlated with regulatory impact scores. Results are averaged expression impact scores for each group and were analyzed by a Student t test.


