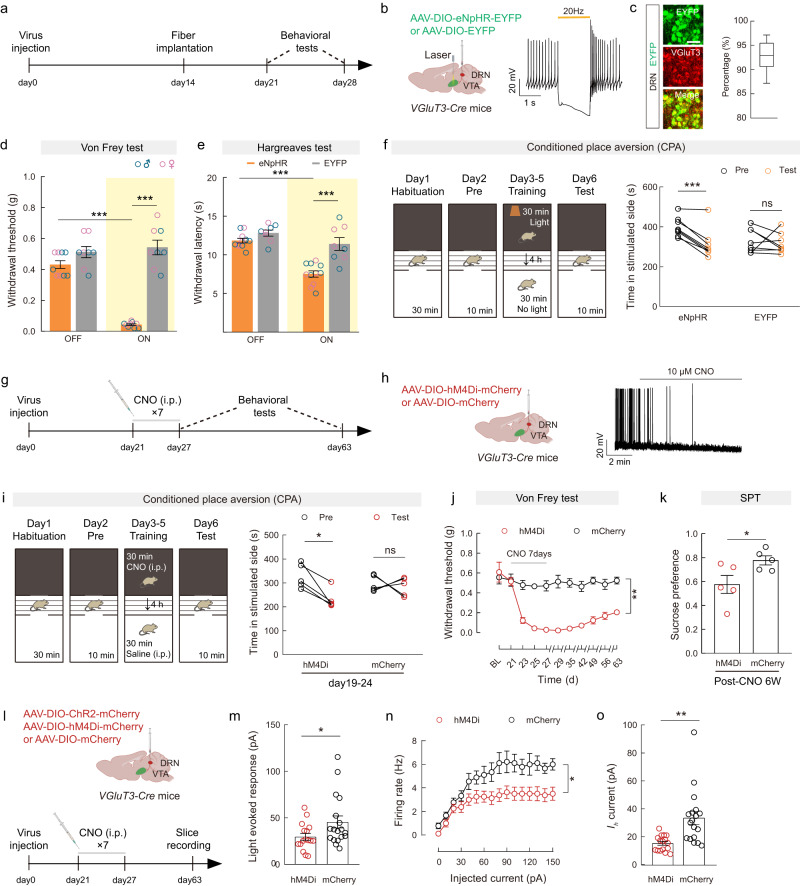
Fig. 3. Inactivation of VGluT3DRN→VTA terminals is sufficient to induce reflexive hypersensitivity and comorbid anhedonia.
a, g, l Schematic of the experimental design. b Schematic diagram of viral injection and optical fiber implantation (left), and a representative trace of action potential firing of an eNpHR-expressing neuron during light photostimulation (right). c Representative images (left) and summary data (right) for the percentage of EYFP-expressing neurons co-localized with VGluT3 immunofluorescence in the DRN, n = 9 sections from 3 mice. Scale bar, 50 μm. d, e Mechanical paw withdrawal threshold (d: eNpHR, n = 9; EYFP, n = 8. P < 0.0001) and thermal paw withdrawal latency (e: eNpHR, n = 11; EYFP, n = 8. P < 0.0001) with (on) or without (off) optogenetic stimulation. f Experimental design of conditional place aversion (CPA) test (left) and quantification of CPA training (right). eNpHR, n = 8; EYFP, n = 8. P = 0.0003. h Schematic diagram of viral injection and optical fiber implantation (left) and a representative trace showing hyperpolarization of the hM4Di-expressing neuron by CNO (right). i Experimental design of CPA test (left) and quantification of training (right). hM4Di, n = 5; mCherry, n = 5. P = 0.0112. j Time-course of mechanical paw withdrawal threshold changes. P = 0.0012. k Preference for sucrose in the SPT, P = 0.0442. m–o Light-evoked EPSCs (m: P = 0.0493), firing rate (n: P = 0.0332) and Ih (o: P = 0.0002) recorded from VGluT3DRN-targeted postsynaptic DAVTA neurons. hM4Di, n = 16 cells from 3 mice; mCherry, n = 18 cells from 3 mice. Significance was assessed by two-way ANOVA followed by Bonferroni’s multiple comparisons test in (d, e, j, n), two-tailed paired Student’s t-test in (f, i), two-tailed unpaired Student’s t-test in (k), and two-tailed Mann–Whitney U test in (m, o). All data are presented as the mean ± s.e.m except for (c), shown as box and whisker plots (medians, quartiles (boxes) and ranges from minimum to maximum (whiskers)). *P < 0.05, **P < 0.01, ***P < 0.001, not significant (ns). Details of the statistical analyses are presented in Supplementary Data 1. Created with BioRender.com (b, h, l).

