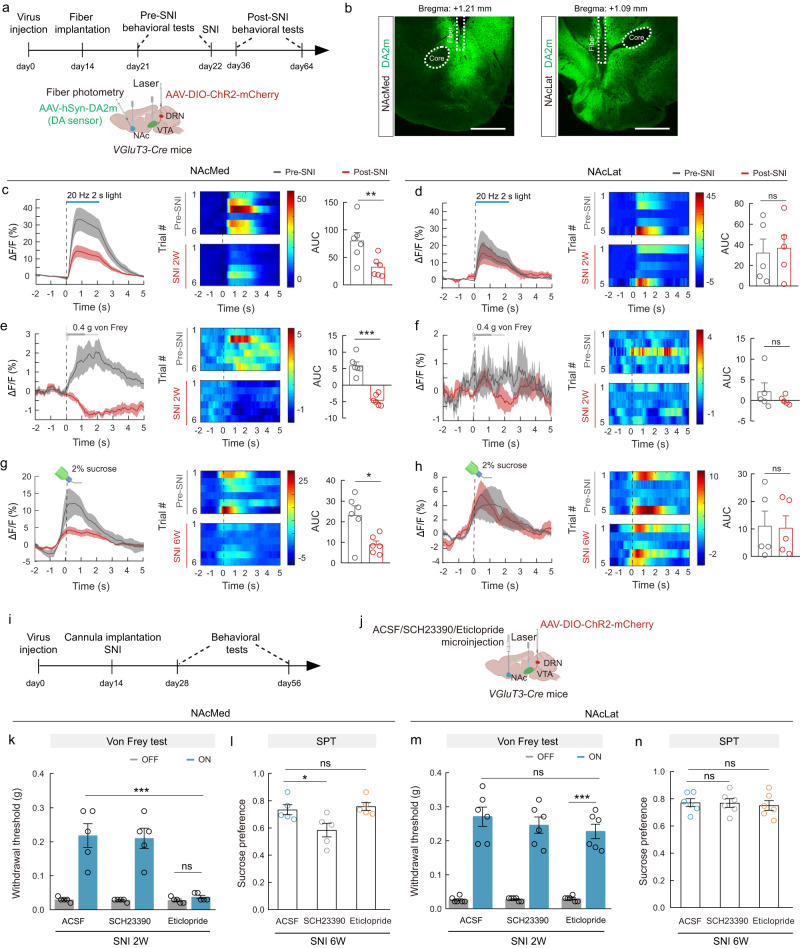
Fig. 4. The VGluT3DRN→DAVTA circuit for neuropathic pain-induced inhibition of DA release outputs to the medial NAc.
a, i Schematic of the experimental design (top) and schematic diagram of viral injection, VTA laser stimulation, and NAc fiber photometry of DA sensor in VGluT3-Cre mice (bottom). b Representative images showing optical fiber track for fiber photometry recordings in the NAcMed (left) and NAcLat (right). Scale bars, 500 μm. c–h Averaged responses (left), heatmaps (middle), and AUC during 0–5 s (right) showing DA2m signals evoked by optogenetic activation of VGluT3DRN→VTA terminals (c: P = 0.0027, d: P = 0.7926), 0.4 g von Frey stimulation (e: P = 0.0001, f: P = 0.3838) in pre- and post-SNI 2W mice and sucrose licking in pre- and post-SNI 6W mice compared with pre-SNI mice (g: P = 0.0202, h: P = 0.9069). NAcMed group, n = 6; NAcLat group, n = 5. j Schematic diagram of DRN viral injection, VTA laser stimulation, and NAc drug delivery cannula implantation. k–n Effects of optogenetic activation of VGluT3DRN→VTA terminals on the von Frey test and SPT with drug infusion into the NAcMed (k: ACSF&ON vs Eticlopride&ON P < 0.0001; Eticlopride&ON vs Eticlopride&OFF P > 0.9999, l: ACSF vs SCH23390 P = 0.037, ACSF vs Eticlopride P = 0.8775. n = 5 mice) and NAcLat (m: ACSF&ON vs Eticlopride&ON P > 0.9999; Eticlopride&ON vs Eticlopride&OFF P < 0.0001, n: ACSF vs SCH23390 P = 0.9983, ACSF vs Eticlopride P = 0.8684. n = 6 mice). Significance was assessed by two-tailed paired Student’s t-test in (c–h), two-way ANOVA followed by Bonferroni’s multiple comparisons test in (k, m), and one-way ANOVA followed by Bonferroni’s multiple comparisons test in (l, n). All data are presented as the mean ± s.e.m. *P < 0.05, **P < 0.01, ***P < 0.001, not significant (ns). Details of the statistical analyses are presented in Supplementary Data 1. Created with BioRender.com (a, e–h, j).

