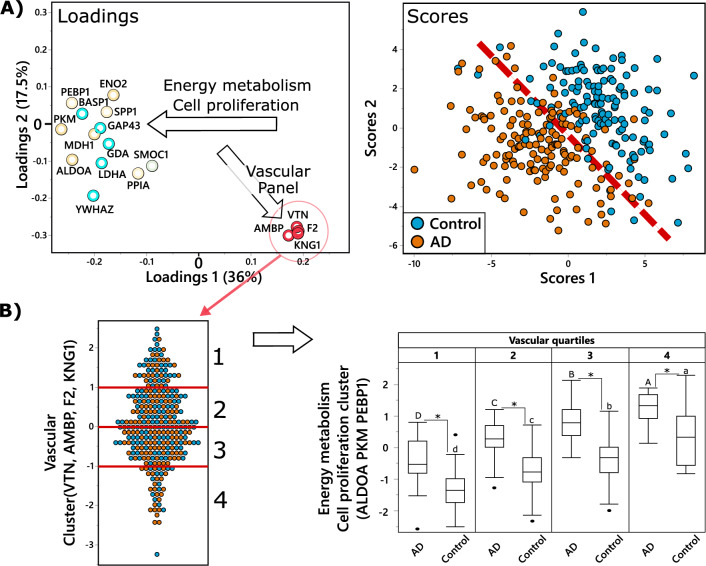
Figure 5.
Vascular panel proteins modify relation between energy metabolism-related proteins and AD. (A) Partial least square discriminant analysis (PLS-DA) of AD (n = 151) vs control (n = 142), utilizing CSF proteins. Treatment group discrimination is shown by the SCORES (right panel). The dashed line was added to help show the plain of separation between the two groups. with a plane of discrimination indicated by dashed read line, while metabolites weighting in group discrimination are shown by the LOADINGS (left panel). Proteins in the loading plot are colored based on functional panels, same as in in Figs. S2–S5. To facilitate interpretation, arrows on the loading plot indicate directionality, arrow labels indicate the function of discriminating proteins. Analysis was performed with all measured proteins, but only those with variable importance in projection (VIP) ≥ 1 are displayed for clarity. (B) Illustration of the relationship between vascular panel proteins (VTN, F2, AMBP, KNG1) and key proteins involved in energy metabolism and cell proliferation (ALDOA, PKM, PEBP1). The panel on the left shows the distribution of the vascular proteins composite score among the subjects, with red lines showing quartiles. The panel on the right shows box and whiskers plots of energy metabolism protein composite score in AD cases and controls, in subjects corresponding to each quartile of the composite score of the vascular panel. Difference in means for each vascular quartile was tested separately for AD cases and healthy controls, using ANOVA with Tukey post-test, with significant differences indicated by capital letters for AD cases and lower letter for the control group. Additionally, differences between AD cases and controls within each vascular quartile was tested using a t-test and significant differences are indicated by an asterisk.

