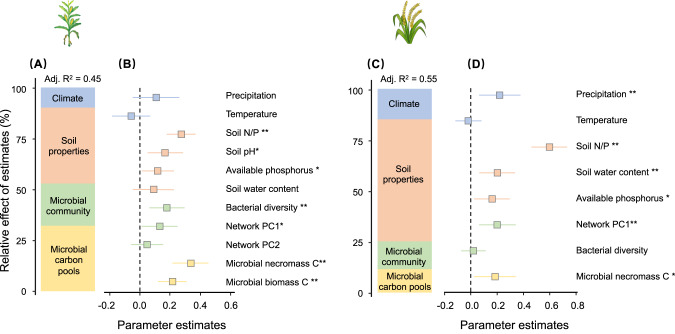
Fig. 5. Relative effects of multiple predictors on soil organic carbon.
The averaged parameter estimates (standardized regression coefficients) of the model predictors are shown with their associated 95% confidence intervals (A and C) along with the relative importance of each predictor, expressed as the percentage of explained variance (B and D) for maize and rice. The best model is selected based on the AICc (Supplementary Table S3). The relative effect of the predictors is calculated as the ratio between the parameter estimate of the predictor and the sum of all parameter estimates, and it is expressed as a percentage. The climate includes mean growing season precipitation (Precipitation) and mean growing season temperature (Temperature) at each location; soil properties include soil nitrogen and phosphorus ratio (soil N/P), soil pH, soil available phosphorus and soil water content; microbial community properties include bacterial diversity and network compelxity (Network PC1 and PC2); soil microbial carbon pools include microbial biomass and necromass carbon. *P < 0.05; **P < 0.01.

