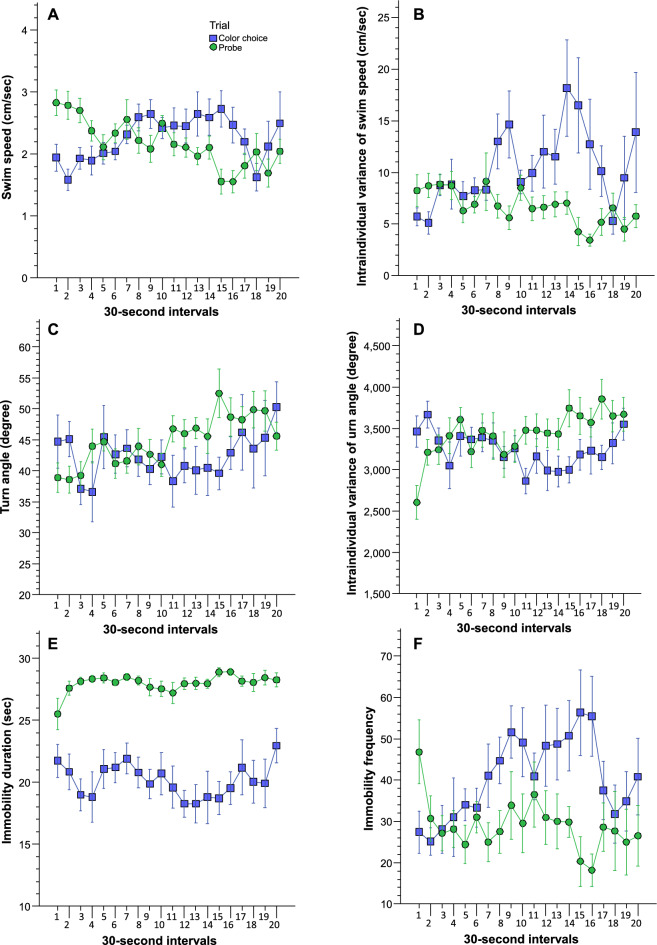
Figure 2.
Swim path parameters (swim speed (A); intraindividual temporal variance of swim speed (B); turn angle (C), intraindividual temporal variance of turn angle (D); immobility duration (E); and Immobility frequency (F) recorded during the last colour choice trial, i.e., before training (blue rectangles) and the probe trial (green circles), i.e., after training are shown as a function of 30-s time intervals. Means ± S.E.M. are shown. For statistical analysis results, see “Results”.

