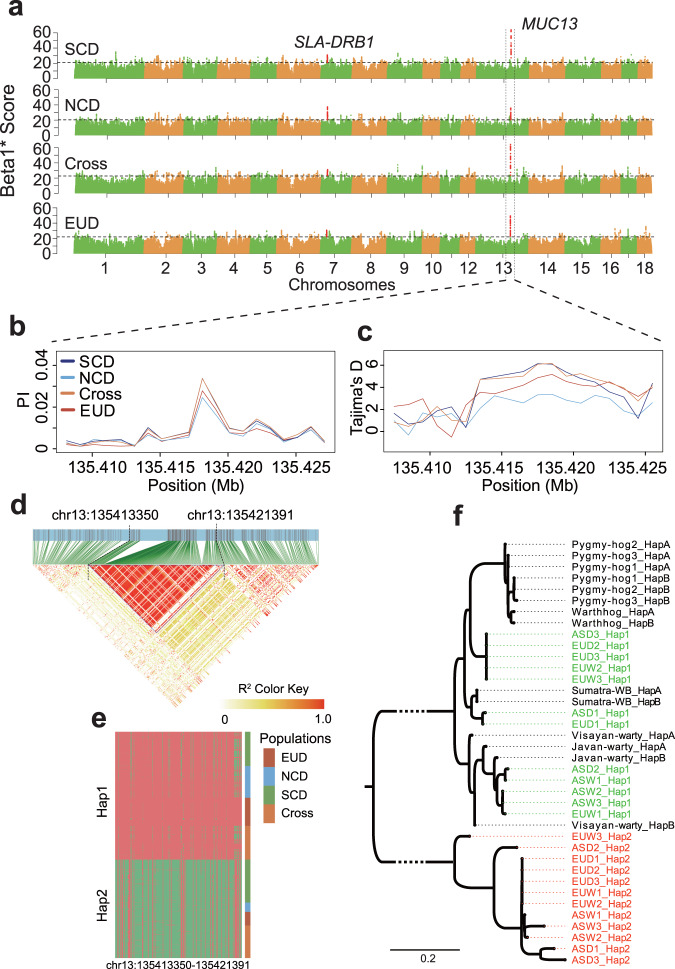
Fig. 2. Detecting MUC13 as a long-term balancing selection gene.
a Scanning the genome for balancing selection loci on autosomes in the following four populations: SCD, Southeastern Chinese domestic pigs; NCD, Northwestern Chinese domestic pigs; Cross, European and Eurasian crossbred pigs; EUD, European domestic pigs. The x-axis shows chromosomes. The y-axis denotes a summary statistic, Beta1* Score, which detects these clusters of alleles within 1 kb at similar frequencies. Each dot denotes a variant. The significance threshold was set to a false discovery rate of 0.01%. The nucleotide diversity b and Tajima’s D c at MUC13 locus by a sliding 1 kb window. Colored lines represent populations. d The Linkage Disequilibrium (LD) pattern at MUC13 locus. The color of the grid represents the degree of LD measured by R2. e Two haplotype patterns inside the haplotype block of MUC13 in populations EUD, NCD, SCD, and Cross. Rows represent haplotypes sorted by type and population. Columns denote variants from position chr13:135413350 to 135421391. The lattices in red/green indicate reference/alternative alleles. f The phylogenetic relationship of haplotypes within the balancing selection block from three Asian domestic pigs (ASD), three Asian wild pigs (ASW), three European domestic pigs (EUD), three European wild pigs (EUW), one Indonesian wild boar from Sumatra (Sumatra-WB), one Visayan warty pig from the Philippines (Visayan-warty), one Javan warty pig from Indonesia (Javan-warty), one common warthog from Africa (Warthhog), and three Pygmy hogs from India (Pygmy-hog). The Pygmy-hog2_HapA represents the one of haplotypes of the Pygmy-hog2 individual. The ASD3_Hap1 represents haplotype 1 of the ASD3 individual.

