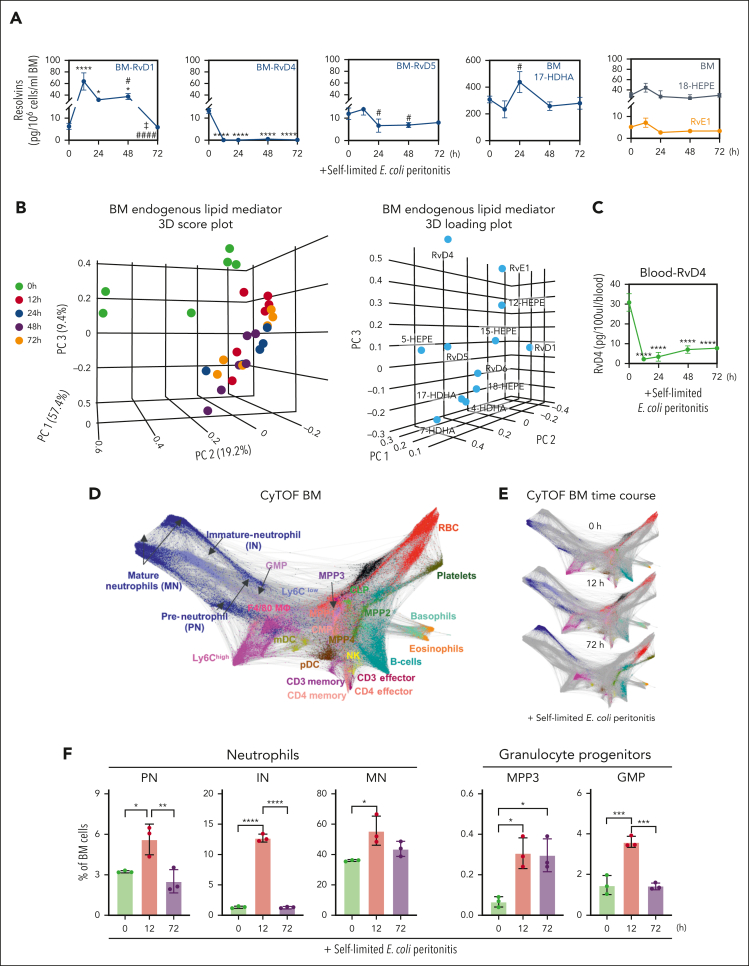
Figure 2.
Time-dependent changes in BM Rvs. (A) Time course of D-series Rvs and proresolving mediators in the BM from targeted LC-MS/MS. (B) Principal component analysis of time course of BM Rvs and proresolving mediators; (left) 3D scoring plot, and (right) 3D loading plot. Results are expressed as mean ± standard error of the mean (SEM); n = 4 or 6 mice per time point, panels A-B. Panel A: time 0 vs 12, 24, 48, and 72 hours, respectively; ∗P < .05, ∗∗P < .01, ∗∗∗P < .001, ∗∗∗∗P < .0001. Panel A: time 0 vs 12, 24, 48, and 72 hours, respectively, ∗P < .05, ∗∗∗∗P < .0001; 12 hours vs 48 and 72 hours, respectively, #P < .05, ####P < .0001; 48 vs 72 hours, ‡P < .05. (C) Time course of RvD4 in whole blood as determined with targeted LC-MS/MS. RvD4 blood pooled from 3 mice for each time point. Time 0 vs 12, 24, 48, and 72 hours, respectively; ∗∗∗∗P < .0001. Statistical analysis was carried out using 1-way ANOVA with Bonferroni multiple comparison test. (D-F) CyTOF: BM (CD45+CD41−) isolated from mice with peritonitis at 0, 12, and 72 hours. (D) Composite BM map: force-directed layout (Vortex) showing (94 500 total single cells) clustered by X-shift (n = 3 mice per time point: 0, 12, and 72 hours; ∼10 500 cells per mouse). (E) BM time-course maps: force direct layout. (F) Number of BM neutrophil lineage (PN, preneutrophil; IN, immature neutrophil; and MN, mature neutrophils) and granulocyte stem and progenitor cells (MPP3 and GMPs). Results are mean ± SEM, n = 3 mice per time point. ∗P < .05, ∗∗P < .01, ∗∗∗P < .001, ∗∗∗∗P < 0. 0001. Statistical analysis was performed using 1-way ANOVA with Tukey multiple comparison test.

