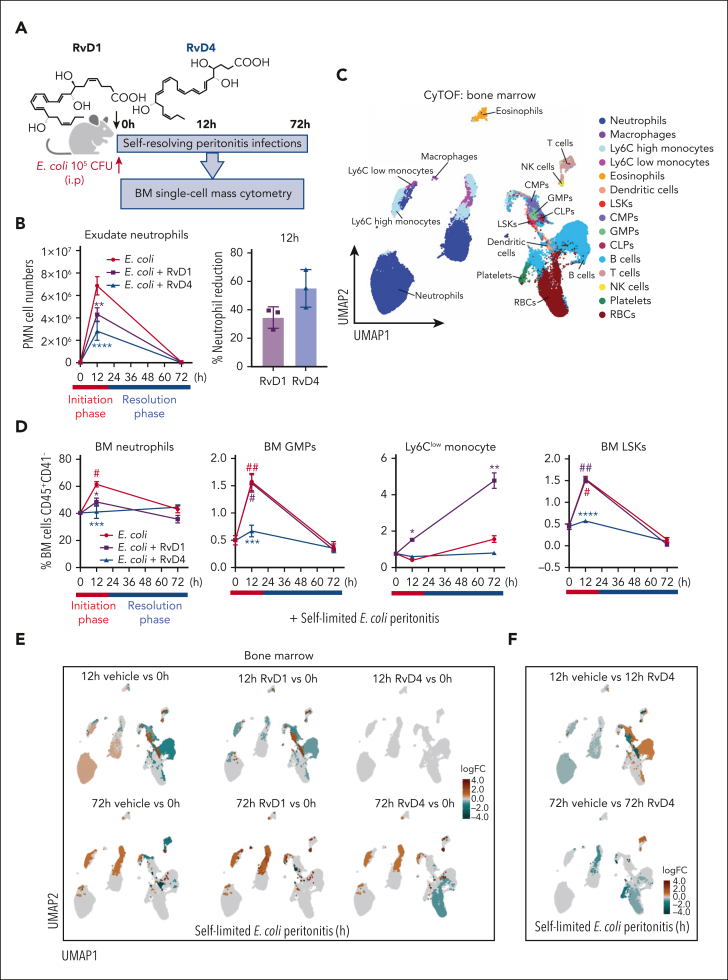
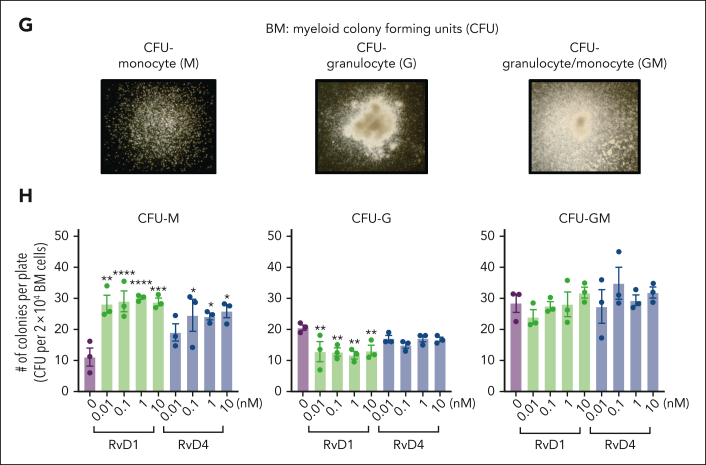
Figure 3.
RvD1 and RvD4 regulate BM myeloid cell production during peritonitis. Mice inoculated with E coli (105 CFU, IP, a self-limited dose; see “Methods”) were administered with RvD1 (100 ng per mouse, IV), RvD4 (100 ng per mouse, IV), or vehicle (0.01% v/v ethanol in saline). Exudates and BM cells were collected at 0 hours, 12 hours (initiation phase), and 72 hours (resolution phase) of the acute inflammatory response. (A) Schematic of the experimental design and sample collection. (B) Cell number of neutrophils in the exudate. (C) CyTOF: BM UMAP labeled with 15 immune populations. (D) The number of BM neutrophils, GMPs, LSKs, and Ly6Clow monocyte cells. Results in panels B-D are mean ± SEM, n = 3 mice per time point. Time 0 hour vs 12 and 72 hours; #P < .05, ##P < .01. Rvs (RvD1 or RvD4) vs E coli + vehicle; ∗P < .05, ∗∗P < .01, ∗∗∗P < .001. Statistical analysis was carried out using 2-way ANOVA with Tukey multiple comparison test. (E) BM UMAPs of log fold-change (logFC) between time 0 vs time points (12 or 72 hours), or treatments (RvD1 or RvD4) calculated using edgeR with diffcyt. (F) BM UMAPs of logFC between E coli + RvD4 vs E coli + vehicle calculated using edgeR with diffcyt. (E-F) Only statistically significant populations are colored (P < .05) and adjusted using a Benjamini-Hochberg correction. (G) Light microscopy photographs of BM myeloid CFUs: M, monocytes (left); G, granulocyte (middle), and GM, macrophage/granulocyte (right), obtained with a 2× objective; representative images. (H) BM myeloid CFU quantification after dose-dependent treatment with vehicle only (0.01% ethanol v/v) or with either RvD1 or RvD4 (0.01-10 nM). CFU counts are per 2 × 10⁴ BM cells. Vehicle vs 0.01, 0.1, 1, or 10 nM; ∗P < .05, ∗∗P < .01, ∗∗∗P < .001, ∗∗∗∗P < .0001. Statistical analysis was carried out using 2-way ANOVA with Bonferroni multiple comparisons test.


