Figure 6.
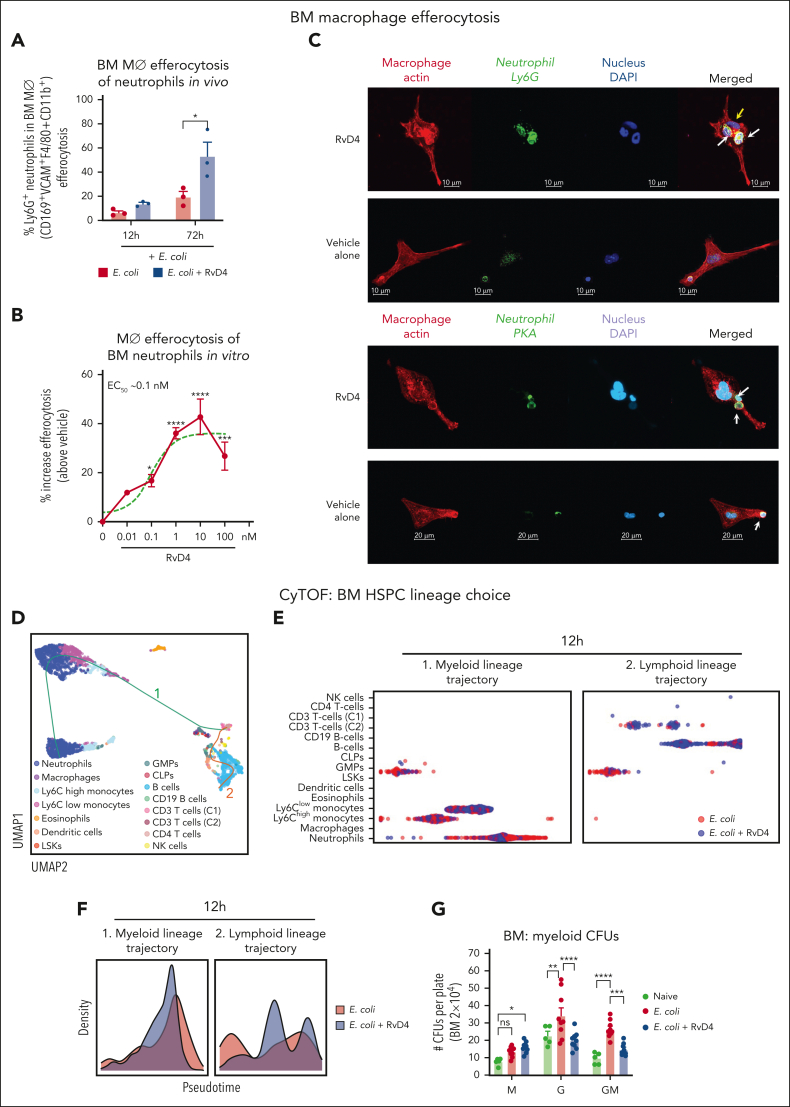
RvD4 increases the CD169+ macrophage efferocytosis of neutrophils in the BM and regulates lineage differentiation. Mice were inoculated with E coli (105 CFU, IP) and received RvD4 (100 ng per mouse, IV) or vehicle only (0.01% v/v ethanol in saline). At 12 and 72 hours after inoculation, BM cells were collected. (A) Flow cytometry for efferocytosis of BM neutrophils by BM macrophages in vivo. Results are mean ± SEM; n = 3 mice per time point; ∗P < .05, vs E coli + vehicle. Statistical analysis was carried out using 1-way ANOVA with Tukey multiple comparison test. (B) Flow cytometry BM macrophage efferocytosis of aged neutrophils (see “Methods”). Dose response: RvD4-induced percent increase in BMDM efferocytosis of aged BM neutrophils relative to that in vehicle-treated cells (solid black line). The 50% effective concentration (EC50) was estimated using nonlinear regression (dashed green line) with log (RvD4) vs response (3 parameters). Results are expressed as mean ± SEM; n = 5 (aged BM neutrophils); ∗P < .05, ∗∗∗P < .001, ∗∗∗∗P < .0001 when compared with vehicle (as control) using 1-way ANOVA with Bonferroni multiple comparison test. (C) Confocal microscopy of BMDM efferocytosis of aged BM neutrophils. The scale bars represent 20 μm (see supplemental Videos 1 [RvD4] and 2 [vehicle] showing 3D reconstruction). The white arrows denote ingested neutrophils by a macrophage. Yellow arrow denotes (supplemental Video 1, RvD4) the #3 neutrophil ingested by a macrophage. Representative of n = 4 mice. (D) CyTOF: UMAP of BM leukocytes single-cell lineage trajectory. (E) CyTOF: BM violin scatter plot of LSKs single-cell trajectory analysis at 12 hours after E coli inoculation. (F) Densities pseudotime plot trajectories. The density plots reflect differences in BM cell densities between RvD4 + E coli vs E coli plus vehicle treatments, at 12 hours. (G) BM myeloid CFUs: M, monocytes; G, granulocyte; and GM, macrophage/granulocyte at 12 hours after E coli inoculation or in naïve control mice. Results are mean ± SEM; n = 5 (naïve) or n = 9 samples (E coli + RvD4, or E coli + vehicle) per time point. E coli + RvD4 vs E coli + vehicle or vs naïve; ∗P < .05, ∗∗P < .01, ∗∗∗P < .001, ∗∗∗∗P < .0001. Statistical analysis was carried out using 2-way ANOVA with Bonferroni multiple comparisons test.

