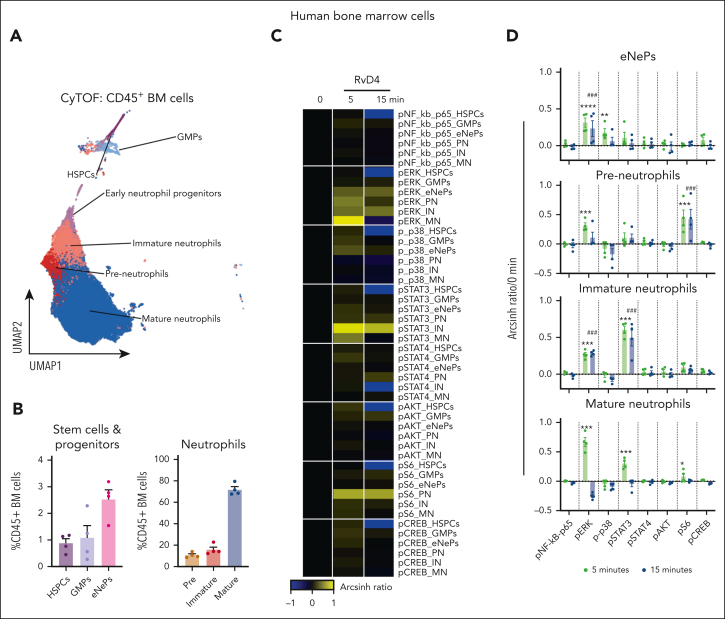
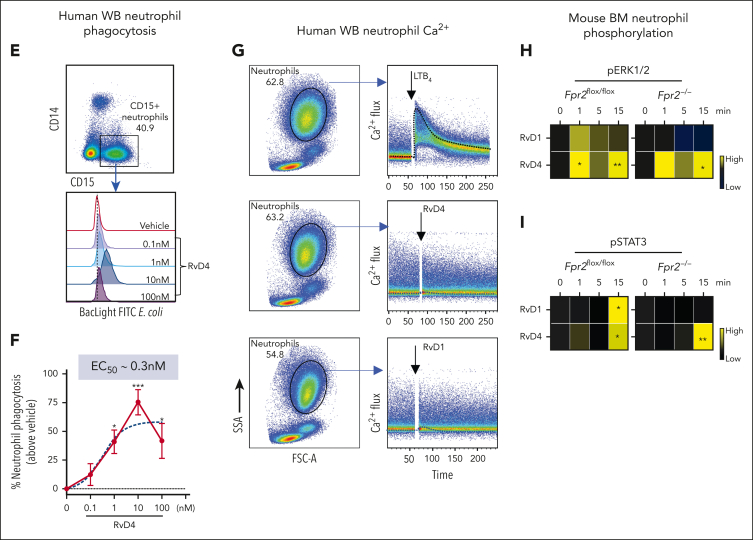
Figure 7.
RvD4 stimulates phosphorylation during human neutrophil differentiation. Human BM aspirates were incubated for 5 and 15 minutes at 37°C with RvD4 (10 nM) or vehicle (0.01% v/v ethanol). CyTOF was carried out using a panel of antibodies targeting intracellular signaling phosphoprotein. (A) BM UMAP granulocyte populations and progenitors. (B) Number of neutrophil populations and progenitors identified in the BM. (C) Heatmap of the mean fold changes in the abundance of the intracellular phosphoproteins in BM cell populations of RvD4-treated aspirates relative to those in aspirates treated with vehicle only (median intensity arcsinh ratio). CREB, cAMP-response element binding protein. (D) Changes in the abundance of the intracellular phosphoproteins in BM cell populations. Results in panel D are expressed as mean ± SEM of n = 4 individual BM donors; 0 vs 5 minutes (RvD4): ∗P < .05, ∗∗P < .01, ∗∗∗P < .001, ∗∗∗∗P < .0001, and 0 vs 15 minutes (RvD4): ###P < .001 by 1-way ANOVA with Bonferroni multiple comparison test. (E) Flow cytometry of human peripheral blood neutrophils (CD45+CD14−CD15+) phagocytosis of Bac-light Green–labeled E coli. (Top) Representative dot plot identifying human neutrophils. (Bottom) Representative histograms of geometric MFIs of Bac-light Green–labeled E coli in neutrophils. (F) Dose response: RvD4-induced percent increase in neutrophil phagocytosis of Bac-light Green–labeled E coli relative to that in vehicle-treated samples. ∗P < .05, ∗∗∗∗P < .0001 when compared with vehicle control. Results are expressed as mean ± SEM, n = 4 healthy human donors. ∗P < .05, ∗∗∗∗P < .0001 when compared with vehicle control. EC50 was estimated using nonlinear regression (dashed line) with log (agonist) vs response (3 parameters). (G) Flow cytometry: calcium influx in human peripheral blood neutrophils incubated with 10 nM of either LTB4, RvD4, or RvD1. Results from n = 4 healthy human donors. (H-I) Flow cytometry: heat maps of phosphorylated signaling ERK1/2 (H) and STAT3 (I) at 0, 1, 5, and 15 minutes after incubation with RvD1 (10 nM) or RvD4 (10 nM) in Fpr2−/− (ALX receptor–deficient mice) and Fpr2flox/flox. Phosphorylation levels were calculated as the difference between the geometric mean signal intensity in RvD1- or RvD4-treated BM neutrophils (at 0, 1, 5, and 15 minutes) and the geometric mean signal intensity in vehicle-treated BM neutrophils at 0 minutes. Results are expressed as mean ± SEM, n = 3 mice from each group; 0 minute vs 1, 5, or 15 minutes, respectively; ∗P < .05, ∗∗P < .01.


