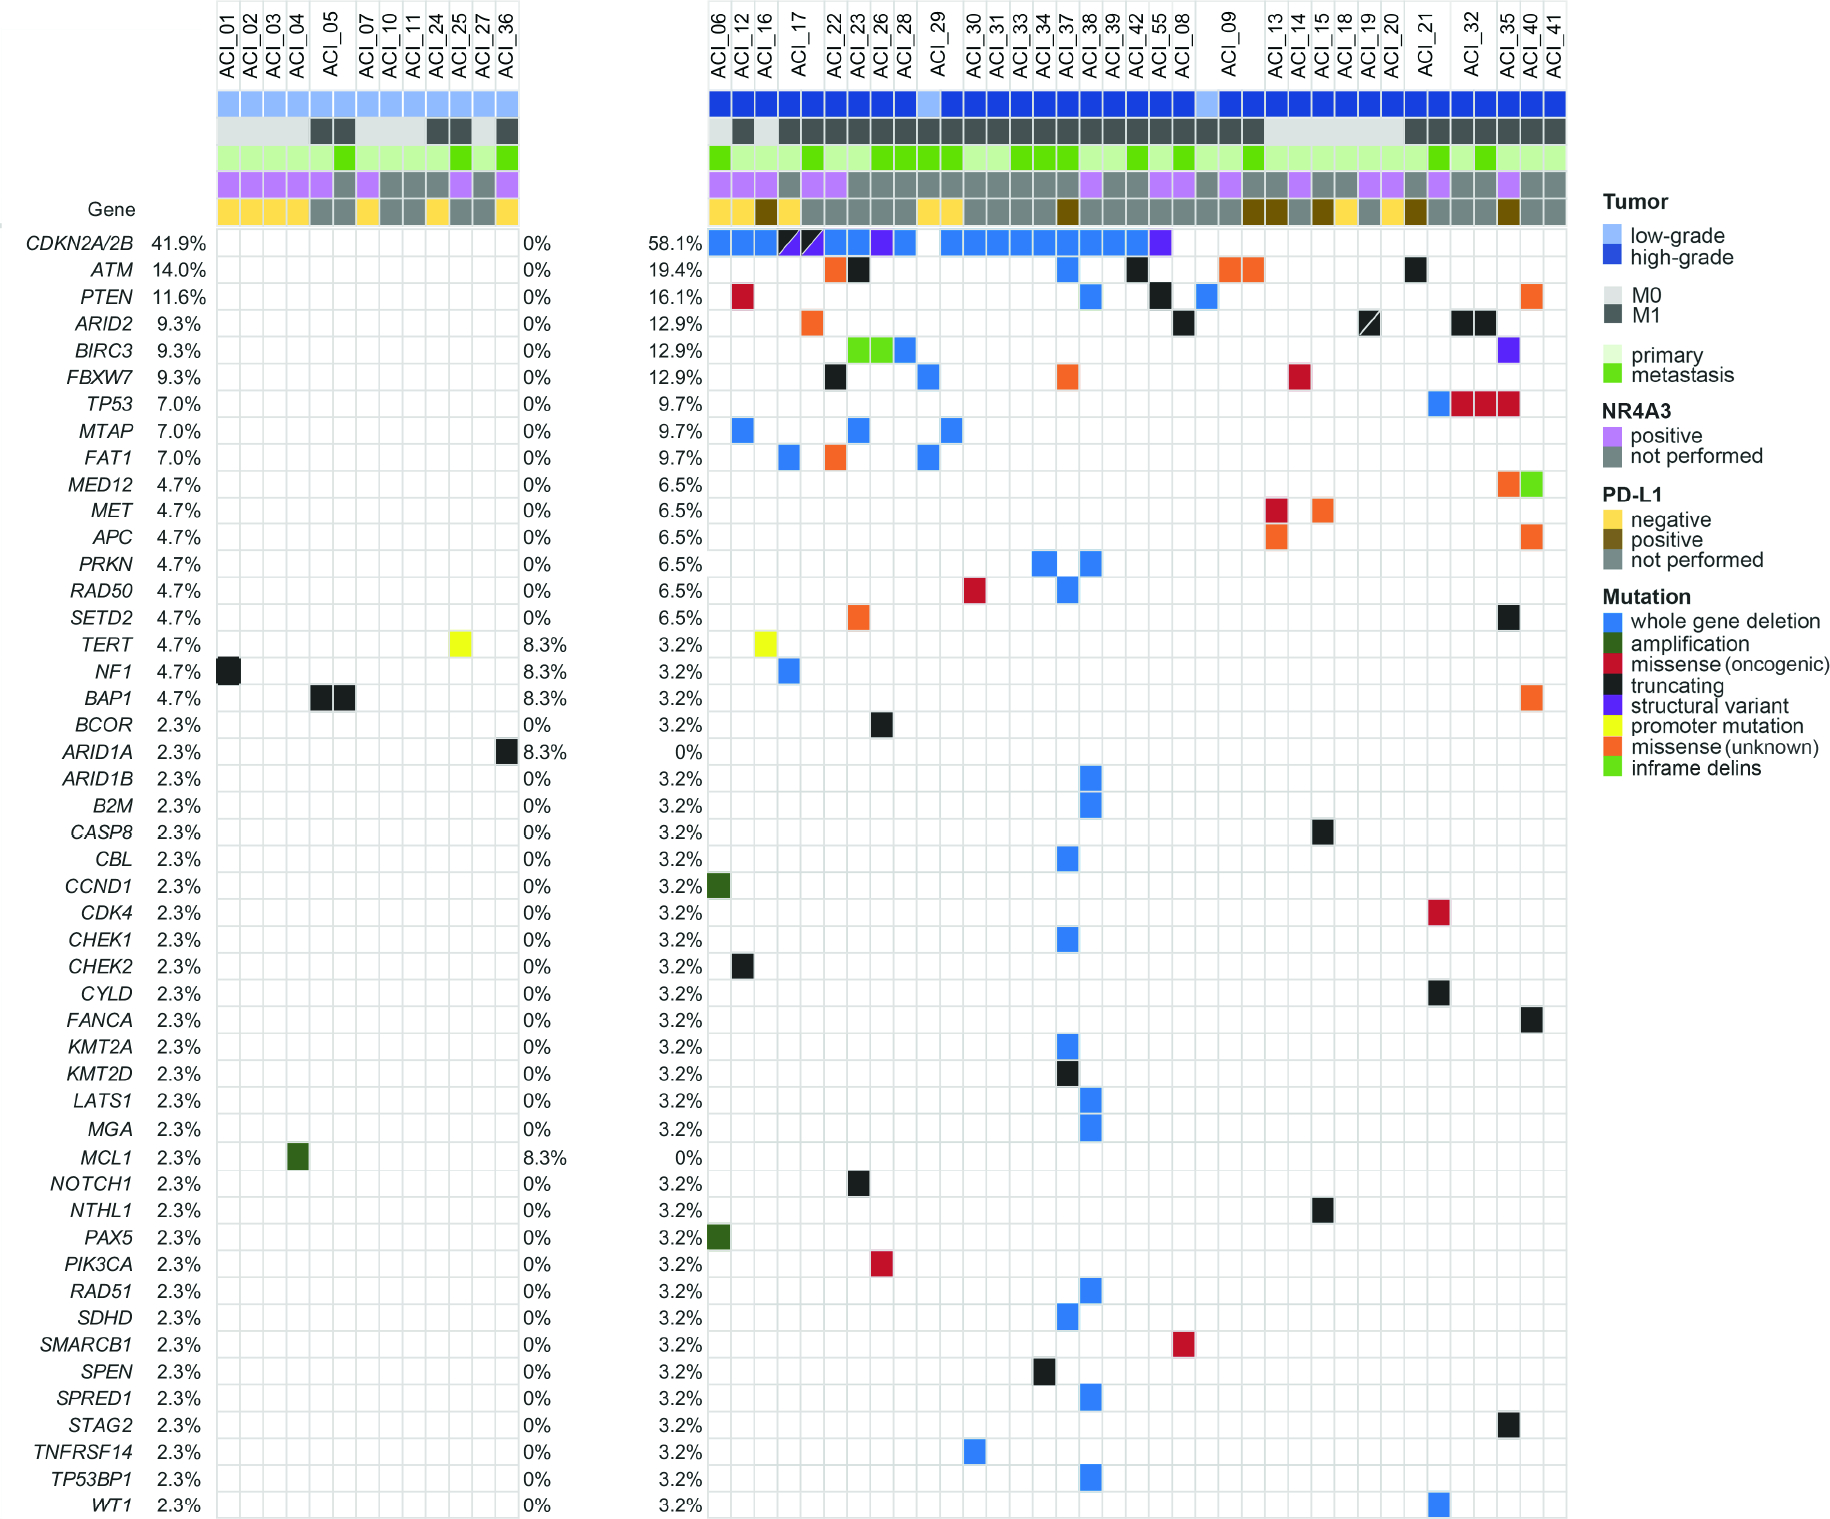
Figure 2.

Oncoprint of oncogenic and/or recurrent genetic alterations in acinic cell carcinoma. Top row represents patients. Frequencies of mutations are calculated per case/patient and represented as percentage occurrence in the entire cohort (left column), in low-grade acinic cell carcinomas (middle column) and in high-grade acinic cell carcinomas (right column).
