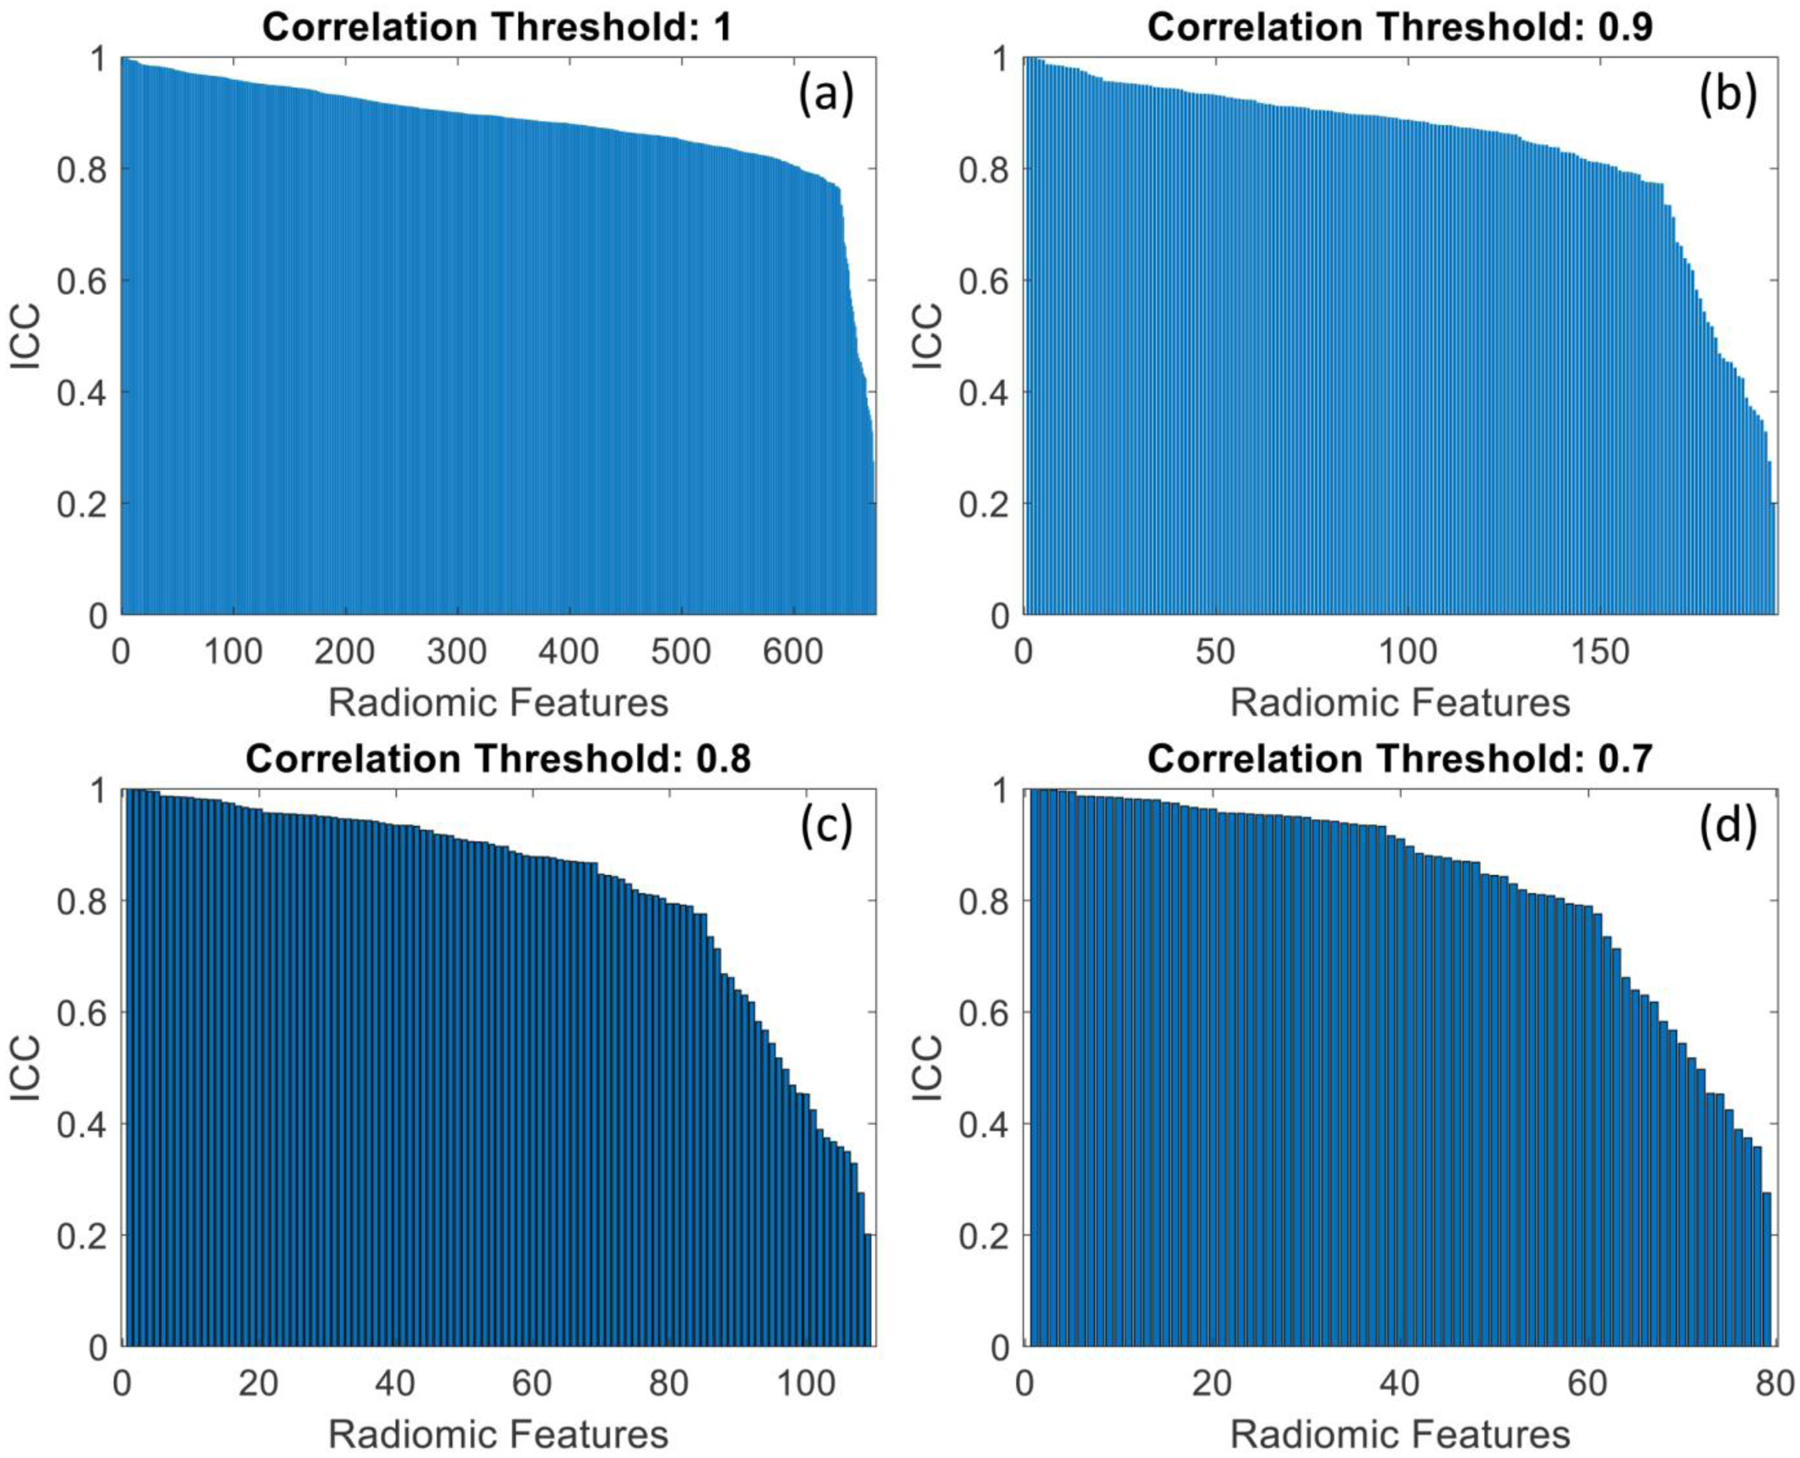
Fig. 7.

Graphs showing the ICC distribution for all radiomic features, when the annotation of all radiologists was simultaneously compared with the deep learning segmentation. Each plot shows the results of the stability analysis for different correlation thresholds, used to eliminate highly correlated features (a: 1; b: 0.9; c: 0.8; d: 0.7).
