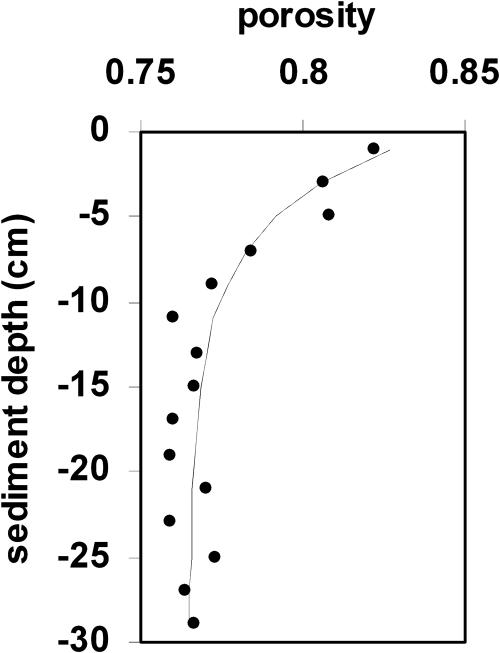
Figure 6. Sediment Porosity Values.
Points represent average porosity at a given depth from 13 sediment cores taken around the periphery of tubeworm aggregations (see Materials and Methods and original data in [13,28]). Best-fitted line based on least squares fit of equation 9.

