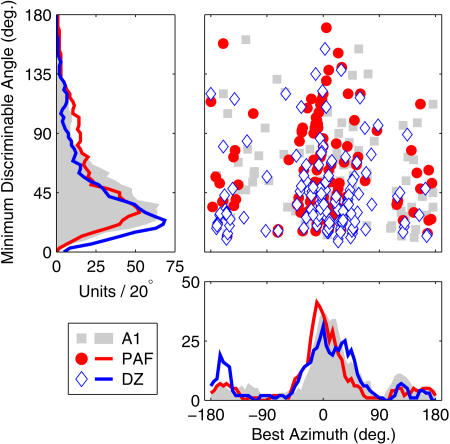
Figure 5. MDA by BA.
MDA (y-axis) is plotted against BA (x-axis) for each unit exhibiting suprathreshold spatial discrimination (see Materials and Methods). Symbols indicate the cortical area of each unit. Left and lower panels plot distributions of MDA and BA (in numbers of units per rectangular 20° bin), respectively.

