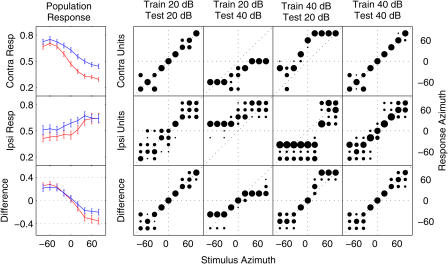
Figure 6. Difference between Channel Responses Is Less Sensitive to Changes in Level Than Are Channel Responses Themselves.
Left: population responses (y-axis; see Materials and Methods) are plotted as a function of azimuth (x-axis) for stimuli presented 20 dB (red) and 40 dB (blue) above unit thresholds. Population responses were computed separately for subpopulations composed of contralateral units (top) or ipsilateral units (middle) corresponding to hypothetical “left” and “right” channels of an opponent-channel spatial coding mechanism. The difference (bottom) between responses of the two subpopulations is more consistent across stimulus level than is either subpopulation response alone. Error bars indicate the standard deviation of responses across 120 simulated trials.
Right: stimulus–response matrices (confusion matrices; see Figure 2) showing the proportion (area of black circle) of responses to a given (unknown) stimulus azimuth (x-axis) classified at each response azimuth (y-axis). Classification assigned each neural population response in the “test” set to the stimulus azimuth whose mean population response in an independently selected set of “training” trials was most similar. In some conditions, test and training trials were drawn from the same set of (matching level) trials: 20 dB (first column) or 40 dB (far right column). In others, test and training trials reflected different-level stimuli: 40-dB test stimuli classified based on a 20-dB training set (second column), or 20-dB test stimuli classified based on a 40-dB training set (third column). The contralateral and ipsilateral subpopulation responses (top and middle rows) accurately localize fixed-level stimuli, but are strongly biased when tested at non-trained stimulus levels. In contrast, the difference between responses (bottom row) remains relatively unbiased in all conditions, although responses to stimuli at untrained levels do exhibit compressed range and increased variability of classification.

