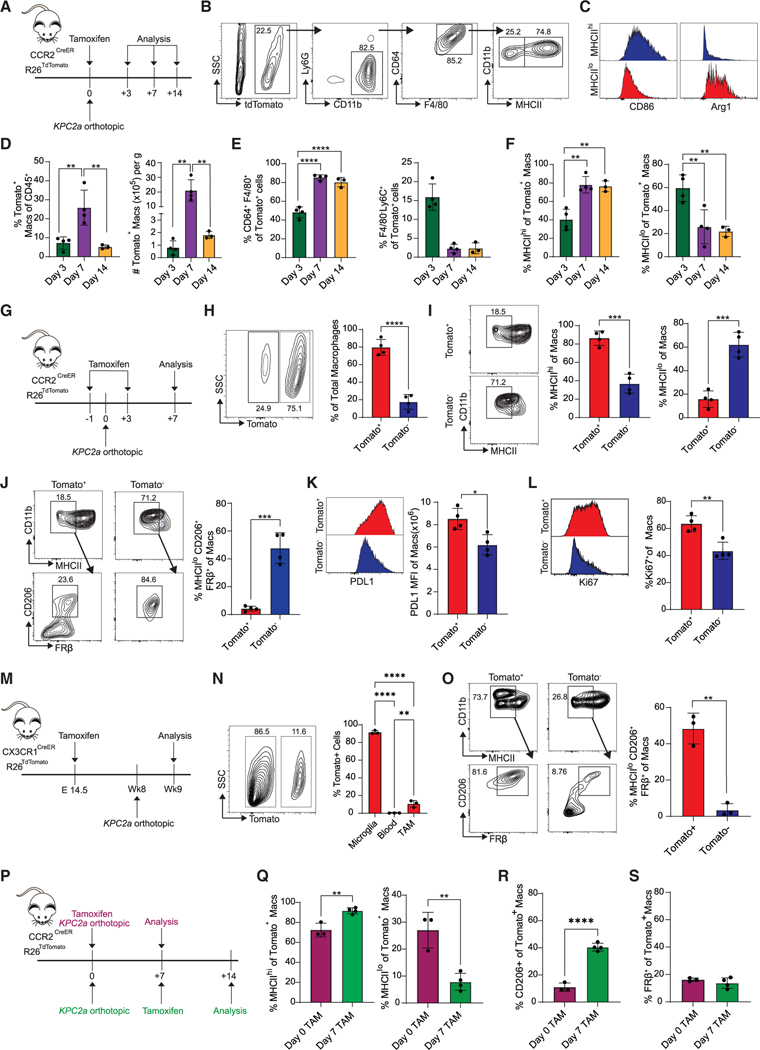
Figure 1. Fate mapping of monocyte-derived or tissue-resident macrophages in PDA.
(A) In vivo monocyte tracking approach in CCR2CreER R26TdTomato mice orthotopically implanted with KPC2a tumor cells and treated with tamoxifen. See also Figure S1.
(B) Gating strategy for Tomato+ MHCIIhi and MHCIIlo macrophages.
(C) Representative CD86 and Arg1 histograms gated on Tomato+ MHCIIhi or MHCIIlo TAMs.
(D) Frequency and number of Tomato+ TAMs. Each dot is an independent mouse. Data are mean ± SEM; n = 3–4 mice per group; **p < 0.005; one-way ANOVA with Tukey’s posttest.
(E) Proportion of intratumoral Tomato+ cells that are macrophages (CD64+F4/80+) or monocytes (F4/80−Ly6C+). Each dot is an independent mouse. Data are mean ± SEM; n = 3–4 mice per group; ****p < 0.0001; one-way ANOVA with Tukey’s posttest.
(F) Proportion of intratumoral Tomato+ MHCIIhi or MHCIIlo macrophages. Each dot is an independent mouse. Data are mean ± SEM; n = 3–4 mice per group; **p < 0.005; one-way ANOVA with Tukey’s posttest.
(G) In vivo monocyte tracking approach in CCR2CreER R26TdTomato mice implanted with KPC2a tumor cells and treated with tamoxifen twice.
(H) Representative plot gated on intratumoral F4/80+CD64+ macrophages on day 7. Proportion of total Tomato+ macrophages. Each dot is an independent mouse. Data are mean ± SEM; n = 4 mice per group; ****p < 0.0001; Student’s t test.
(I) Representative plots gated on day 7 and proportion of Tomato+ or Tomato− intratumoral MHCIIhi or MHCIIlo macrophages on day 7. Each dot is an independent mouse. Data are mean ± SEM; n = 4 mice per group; ***p < 0.001; Student’s t test.
(J) Representative plots gated on day 7 and proportion of Tomato+ and Tomato− MHCIIloCD206+FRβ+ macrophages on day 7. Each dot is an independent mouse. Data are mean ± SEM; n = 4 mice per group; ***p < 0.001; Student’s t test.
(K) PD-L1 staining and mean fluorescence intensity (MFI) of Tomato+ and Tomato− macrophages at day 7. Each dot is an independent mouse. Data are mean ±SEM; n = 4 mice per group; *p < 0.05; Student’s t test.
(L) Representative histograms and frequency of Ki67+ macrophages on day 7. Each dot is an independent mouse. Data are mean ± SEM; n = 4 mice per group; **p < 0.005; Student’s t test.
(M) Embryonic fate-mapping approach in CX3CR1CreER R26TdTomato. Briefly, pregnant mothers were gavaged with tamoxifen on embryonic day 14.5 and then progeny were implanted with tumors. See also Figure S2.
(N) Representative plot gated on intratumoral F4/80+CD64+ macrophages on day 7 from (M). Proportion of each cell subtype that is Tomato+ is shown. Each dot is an independent mouse. Data are mean ± SEM; n = 3 mice per group; **p < 0.005, ****p < 0.0001; one-way ANOVA with Tukey’s post test.
(O) Representative plots gated on day 7 and proportion of Tomato+ and Tomato− MHCIIloCD206+FRβ+ tumor macrophages. Each dot is an independent mouse. Data are mean ± SEM; n = 3 mice per group; **p < 0.005; Student’s t test.
(P) Experimental schematic to label the initial wave of recruited monocytes (purple) or subsequent waves of recruited monocytes (green).
(Q) Proportion of each monocyte wave that gives rise to MHCIIhi or MHCIIlo macrophages. Each dot is an independent mouse. Data are mean ± SEM; n = 3–4 mice per group; **p < 0.005; Student’s t test.
(R) Proportion of each monocyte wave that gives rise to CD206+ macrophages. Each dot is an independent mouse. Data are mean ± SEM; n = 3–4 mice per group;****p < 0.0001; Student’s t test.
(S) Proportion of each monocyte wave that gives rise to FRβ+ macrophages. Each dot is an independent mouse. Data are mean ± SEM; n = 3–4 mice per group.

