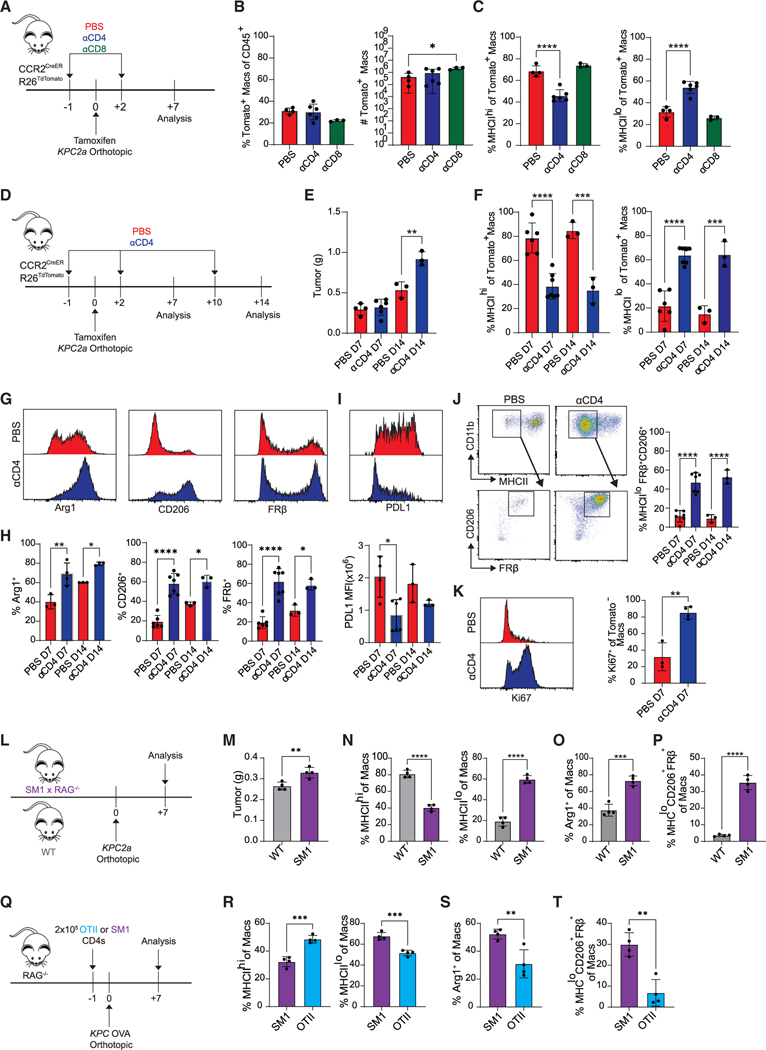
Figure 2. CD4 T cells govern fate decisions of tumor-infiltrating monocytes.
(A) Experimental approach to test the role of T cell subsets on monocyte fate.
(B) Proportion (left) and number (right) of Tomato+ intratumoral macrophages. Each dot is an independent mouse. Data are mean ± SEM; n = 3–5 mice per group; *p < 0.05; one-way ANOVA with Tukey’s posttest.
(C) Proportion of MHCIIhi or MHCIIlo Tomato+ macrophages. Each dot is an independent mouse. Data are mean ± SEM; n = 3–5 mice per group; ****p < 0.0001; one-way ANOVA with Tukey’s posttest.
(D) Experimental approach to test the impact of prolonged CD4 T cell depletion in tumor-bearing CCR2CreER R26TdTomato mice. See also Figure S3.
(E) Tumor weight from mice in (D); n = 3–6 mice per group. Data are mean ± SEM; **p < 0.005; Student’s t test for each time point.
(F) Proportion of Tomato+ macrophages from (D) that are MHCIIhi or MHCIIlo. Data are mean ± SEM; n = 3–6 mice per group; ***p < 0.001, ****p < 0.0001; Student’s t test for each time point.
(G) Representative histograms gated on Tomato+ macrophages isolated from PBS- or αCD4-treated mice.
(H) Proportion of Tomato+ macrophages expressing Arg1, CD206, and FRβ from PBS- or αCD4-treated mice. Data are mean ± SEM; n = 3–6 mice per group;*p < 0.05, **p < 0.005, ****p < 0.0001; Student’s t test for each time point.
(I) Representative PD-L1 staining (top) and MFI of Tomato+ macrophages from PBS- or αCD4-treated mice (bottom); n = 3–6 mice per group; *p < 0.05; Student’s t test.
(J) Representative plots and proportion of Tomato+ MHCIIlo macrophages that coexpress CD206 and FRβ from mice in (D). Data are mean ± SEM; n = 3–6 mice per group; ****p < 0.0001; Student’s t test for each time point.
(K) Representative histograms and proportion of Tomato− macrophages that are Ki67+. Data are mean ± SEM; n = 3–4 mice per group; **p < 0.005; Student’s t test.
(L) Experimental approach to test the impact of T cell antigen specificity on monocyte differentiation. See also Figures S4A–S4F.
(M) Tumor weight from (L). Data are mean ± SEM; n = 4 mice per group; **p < 0.005; Student’s t test.
(N) Proportion of MHCIIhi or MHCIIlo macrophages from (L). Data are mean ± SEM; n = 4 mice per group; ****p < 0.0001; Student’s t test.
(O) Proportion of Arg1+ macrophages from (L). Data are mean ± SEM; n = 4 mice per group; ***p < 0.001; Student’s t test.
(P) Proportion of MHCIIloCD206+FRβ+ macrophages from (L). Data are mean ± SEM; n = 4 mice per group; ****p < 0.0001; Student’s t test.
(Q) Experimental approach to test if transferred tumor-specific (OTII) or non-specific (SM1) CD4 T cells modulate monocyte differentiation in KPC-OVA-bearing Rag−/− mice. See also Figures S4G–S4I.
(R) Proportion of MHCIIhi or MHCIIlo macrophages from (Q). Data are mean ± SEM; n = 4 mice per group; ***p < 0.001; Student’s t test.
(S) Proportion of Arg1+ macrophages from (Q). Data are mean ± SEM; n = 4 mice per group; **p < 0.005; Student’s t test.
(T) Proportion of MHCIIloCD206+FRβ+ macrophages from (Q). Data are mean ± SEM; n = 4 mice per group; **p < 0.005; Student’s t test. See also Figure S5.

