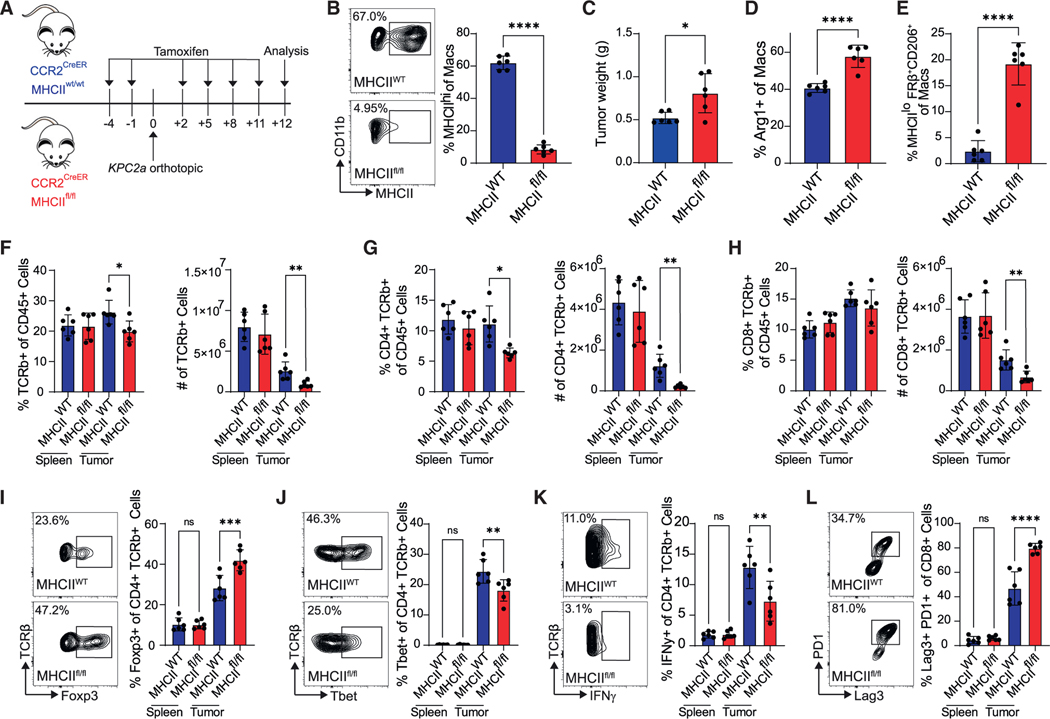
Figure 3. MHC class II on monocyte-derived TAMs promotes Th1 CD4 T cells and anti-tumor immunity.
(A) Experimental approach to test the impact of MHC class II deletion in monocyte-derived macrophages. See also Figure S6.
(B) MHC class II staining gated on TAMs at day 12. Data are mean ± SEM; n = 6 mice per group; ****p < 0.0001; Student’s t test.
(C) Tumor weights. Data are mean ± SEM; n = 6 mice per group; *p < 0.05; Student’s t test.
(D) Proportion of Arg1+ macrophages. Data are mean ± SEM; n = 6 mice per group; ****p < 0.0001; Student’s t test.
(E) Proportion of MHCIIloCD206+FRβ+ macrophages. Data are mean ± SEM; n = 6 mice per group; ****p < 0.0001; Student’s t test.
(F) Frequency and number of T cells. Data are mean ± SEM; n = 6 mice per group; *p < 0.05, **p < 0.005; Student’s t test for each tissue.
(G) Frequency and number of CD4 T cells. Data are mean ± SEM; n = 6 mice per group; *p < 0.05, **p < 0.005; Student’s t test for each tissue.
(H) Frequency and number of CD8 T cells. Data are mean ± SEM; n = 6 mice per group; **p < 0.005; Student’s t test for each tissue.
(I) Representative Foxp3 staining gated on CD4 T cells and frequency. Data are mean ± SEM; n = 6 mice per group; ***p < 0.001; Student’s t test for each tissue.
(J) Frequency of CD4 T cells that are T-bet+. Data are mean ± SEM; n = 6 mice per group; **p < 0.005; Student’s t test for each tissue.
(K) Frequency of CD4 T cells producing IFNγ after ex vivo restimulation. Data are mean ± SEM; n = 6 mice per group; **p < 0.005, Student’s t test for each tissue.
(L) Proportion of CD8 T cells coexpressing Lag3 and PD1. Data are mean ± SEM; n = 6 mice per group; ****p < 0.0001; Student’s t test for each tissue.

