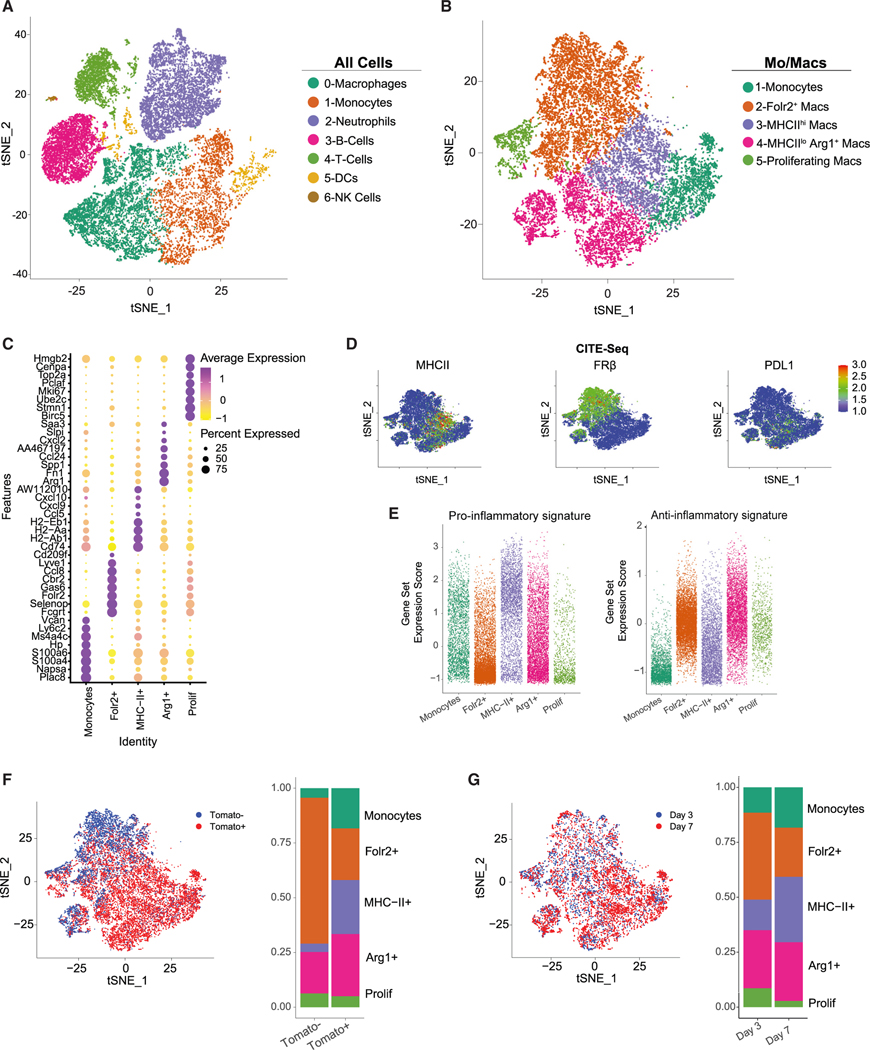
Figure 4. Single-cell fate mapping of monocyte differentiation in PDA.
(A) t-distributed stochastic neighbor embedding (t-SNE) plots of intratumoral immune cells isolated on days 3 and 7 ± αCD4 post tumor (n = 4 orthotopic KPC2a tumors per group). See also Figure S7.
(B) t-SNE plots of only monocytes and macrophage clusters.
(C) Heatmap showing normalized cluster-specific gene expression. See also Figure S8A.
(D) Normalized CITE-seq protein in t-SNE plot.
(E) Gene set enrichment analysis of canonical pro-inflammatory and anti-inflammatory genes split by monocyte/macrophage cluster defined in (B).
(F) t-SNE plot showing Tomato+ and Tomato− cells from days 3 and 7 untreated, and proportion of each monocyte/macrophage cluster among Tomato+ and Tomato− myeloid cells from clusters defined in (B). See also Figure S8B.
(G) t-SNE plot and proportion of each monocyte/macrophage cluster at days 3 and 7. See also Figure S8C.

