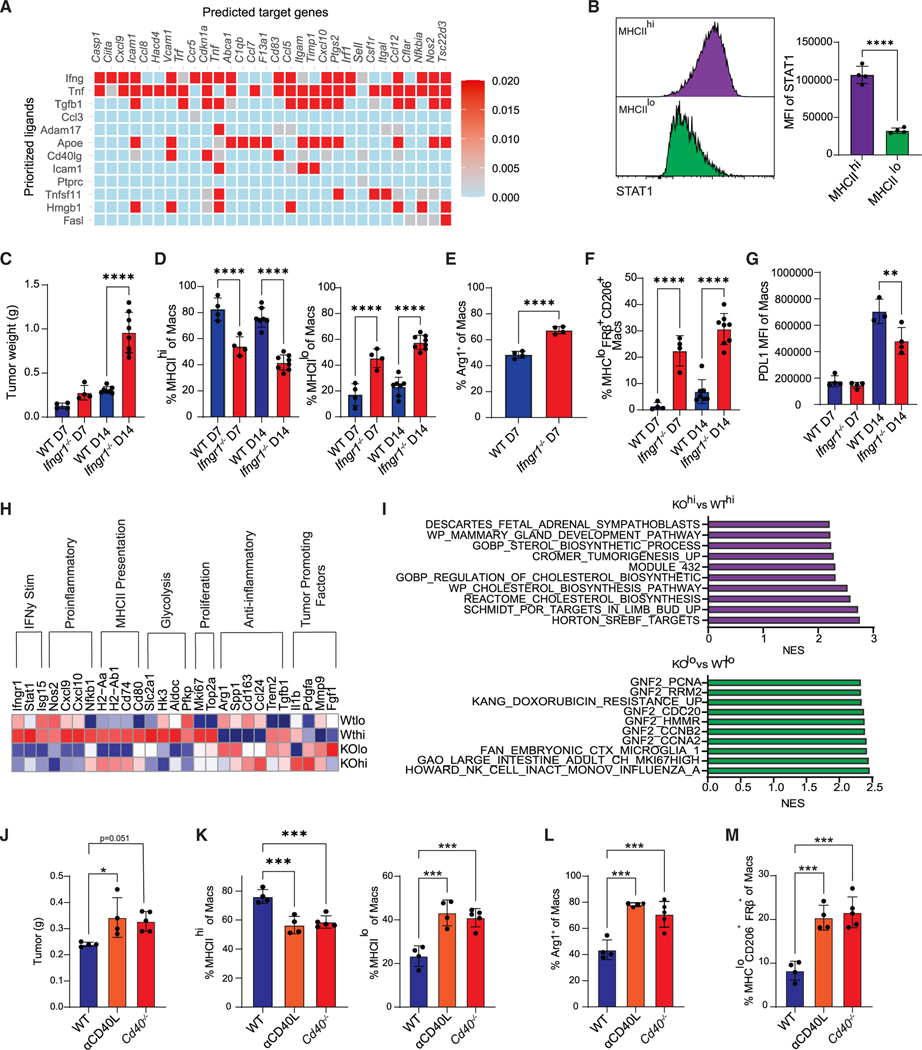
Figure 6. Ifngr1 and CD40 signaling non-redundantly drive anti-tumor TAM fate.
(A) NicheNet analysis from scRNA-seq data from Figure 4 using CD4 T cells as donor cells and MHCIIhi macrophages as acceptor cells. See also Figure S10.
(B) Stat1 staining and MFI in MHCIIhi and MHCIIlo intratumoral macrophages at day 7. Data are mean ± SEM; n = 4 mice per group; ****p < 0.0001; Student’s t test.
(C) Tumor weights from WT or Ifngr1−/− mice; n = 4–8 mice per group; ****p < 0.0001; Student’s t test for each time point.
(D) Proportion of MHCIIhi or MHCIIlo macrophages from WT or Ifngr1−/− mice. Data are mean ± SEM; n = 4–8 mice per group; ****p < 0.0001; Student’s t test for each time point.
(E) Proportion of Arg1+ macrophages on day 7. Data are mean ± SEM; ****p < 0.0001; Student’s t test.
(F) Proportion of MHCIIloCD206+FRβ+ macrophages from WT or Ifngr1−/− mice. Data are mean ± SEM; n = 4–8 mice per group; ****p < 0.0001; Student’s t test for each time point.
(G) PD-L1 MFI gated on total macrophages from WT or Ifngr1−/− mice. Data are mean ± SEM; **p < 0.005; Student’s t test for each time point.
(H) Normalized expression of selected genes from bulk RNA sequencing from sorted live MHCIIhi or MHCIIlo tumor macrophages from WT and Ifngr1−/− mice at day 14. See also Figure S11.
(I) Gene set enrichment analysis (GSEA) of the top 300 differentially expressed genes from sorted cells in (H).
(J) Orthotopic KPC2a tumor weights at day 7 from WT control mice, WT mice treated with CD40L blockade (αCD40L), or Cd40−/− mice. *p < 0.05; one way ANOVA with Tukey’s post test. See also Figure S12.
(K) Proportion of MHCIIhi or MHCIIlo macrophages. Each dot is an independent mouse. Data are mean ± SEM; n = 4–5 mice per group; ***p < 0.001; one-way ANOVA with Tukey’s posttest.
(L) Proportion of Arg1+ macrophages. Each dot is an independent mouse. Data are mean ± SEM; n = 4–5 mice per group; ***p < 0.001; one-way ANOVA with Tukey’s posttest.
(M) Proportion of MHCIIloCD206+FRβ+ macrophages. Each dot is an independent mouse. Data are mean ± SEM; n = 4–5 mice per group; ***p < 0.001; one-way ANOVA with Tukey’s posttest. See also Figure S13.

