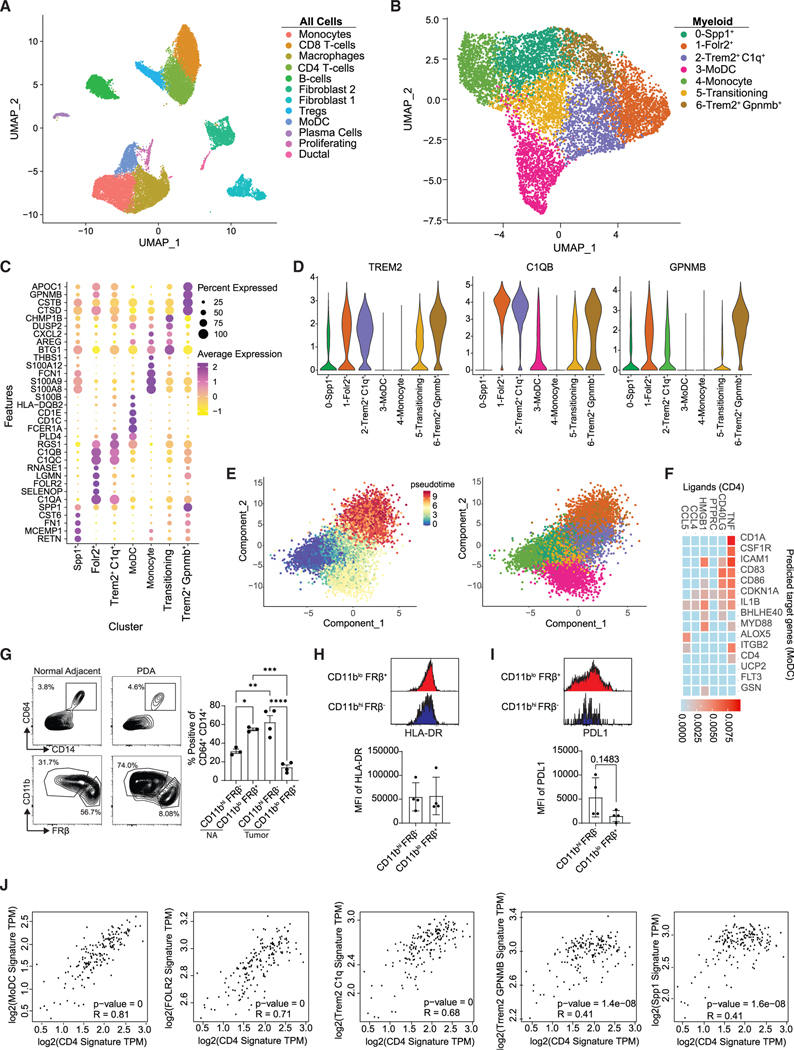
Figure 7. Profiling of TAMs from human PDA.
(A) Uniform manifold approximation and projection (UMAP) of scRNA-seq data from six merged human tumors from Elyada et al.51 See also Figure S14.
(B) UMAP reclustering of myeloid clusters in (A).
(C) Heatmap of normalized gene expression of the top differentially expressed genes.
(D) Violin plots of selected genes.
(E) Pseudotime of myeloid clusters using Monocle 3 split by pseudotime and by cluster.
(F) NicheNet analysis using CD4 T cells as the donor cluster and MoDCs as the acceptor cluster.
(G) Gating scheme and frequency of myeloid subpopulations from resected human PDA (n = 4) and normal adjacent (n = 3) tissue. Gated on live, CD15− cells. Data are mean ± SEM; *p < 0.05, **p < 0.005, ***p < 0.001, ****p < 0.0001; one-way ANOVA with Tukey’s posttest.
(H) Representative HLA-DR staining and HLA-DR MFI from CD11bhiFRβ− and CD11bloFRβ+ macrophages from human PDA and normal adjacent tissue. Data are mean ± SEM. Each dot is an independent sample.
(I) Representative PD-L1 staining and PD-L1 MFI of each population isolated from human PDA.
(J) Correlation of CD4 gene signatures with macrophage subpopulation gene signatures in human PDA. TCGA datasets were determined using GEPIA2. Gene signatures were derived from the top 5 DEGs from (B).

