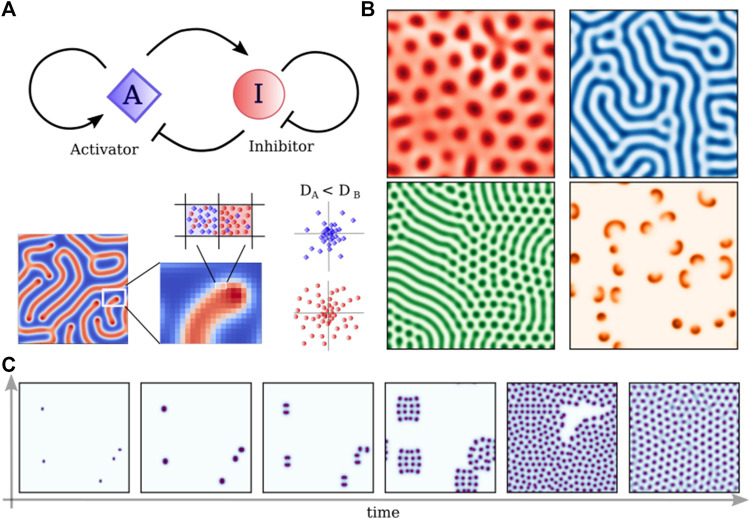
FIGURE 3.
Turing reaction-diffusion models. (A) Schematic representation of a simple Activator-Inhibitor circuit, which can be represented by the set of Eq. 1 with R A = I ⋅ A 2 − (f + k)A and R I = −I ⋅ A 2 + f(1− I). Differences in the diffusion of the two competing molecules create patterns that depend on the specific set of parameters. (B) Patters obtained solving Eq. 1 with different sets of parameters: f = 0.02430, k = 0.05174; f = 0.028, k = 0.056; f = 0.03, k = 0.06; f = 0.00713, k = 0.04651; (C) Time evolution of the “cell-dividing” pattern (f = 0.028, k = 0.062) starting from five random seeds.

