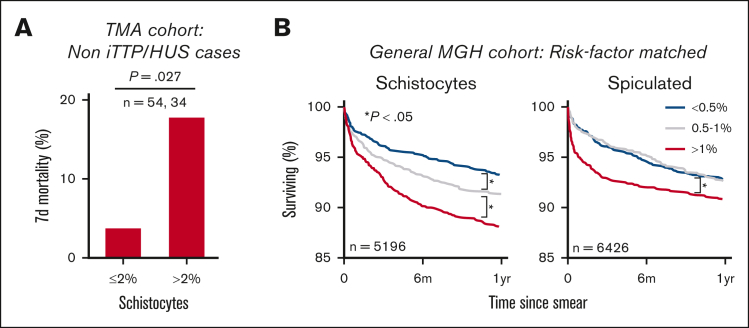
Figure 4.
RBC-diff counts are associated with patient prognosis. (A) Seven-day, all-cause mortality in non iTTP or HUS etiologies in the TMA derivation cohort. (B) Kaplan-Meier survival curves for patients with MGH stratified based on RBC-diff counts from the first available blood smear. Each group in panel B was matched for demographics, comorbidities, smear grading, blood count markers, and other RBC-diff counts (supplemental Methods). The findings in panel B were validated in the BWH cohort (supplemental Figure 8). The significance of the results in panel A was calculated using the χ2 test (P = .027; χ2 = 4.9; df = 1). The significance of survival curves in panel B was determined using a log-rank test, P values (test statistic) for low to midgroup comparisons were .04 (Z = 2.09) and .98 (Z = 0.02) and for high to midgroup comparisons were .003 (Z = 2.98) and .01 (Z = 2.60) for schistocytes and spiculated cells, respectively.

