Figure 5.
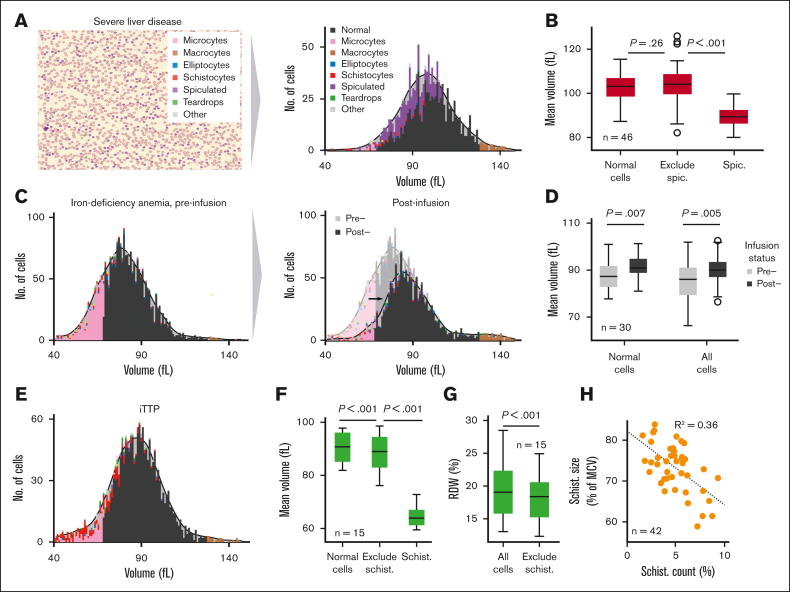
RBC-diff enables the estimation of single-cell volume-morphology distributions. (A) Red cell volume distribution across different RBC morphologies, as estimated from a peripheral smear using RBC-diff. (B) The average estimate cell volume across 46 preoperative patients who underwent liver transplantation for normal cells, spiculated cells, and all cells except spiculated. (C) Red cell volume-morphology distribution in a patient with iron-deficiency anemia (IDA) before and after intravenous iron infusion. (D) Mean cell volume of 30 patients with IDA before and after infusion for all cells and only normal cells. (E) Red cell volume-morphology distribution for a patient with iTTP near the point of ADAMTS13 testing. (F) Mean cell volume of patients with 15 iTTP for normal cells, all cells except schistocytes, and schistocytes. (G) Estimated mean RDW for 15 patients with iTTP for all cells after exclusion of schistocytes. (H) Association between the mean size of schistocytes (relative to the average cell size) and schistocyte count across patients with 15 iTTP (42 smears in total) with schistocyte counts <10%. All significance levels a 2-sample t test. IDA, iron-deficiency anemia.

