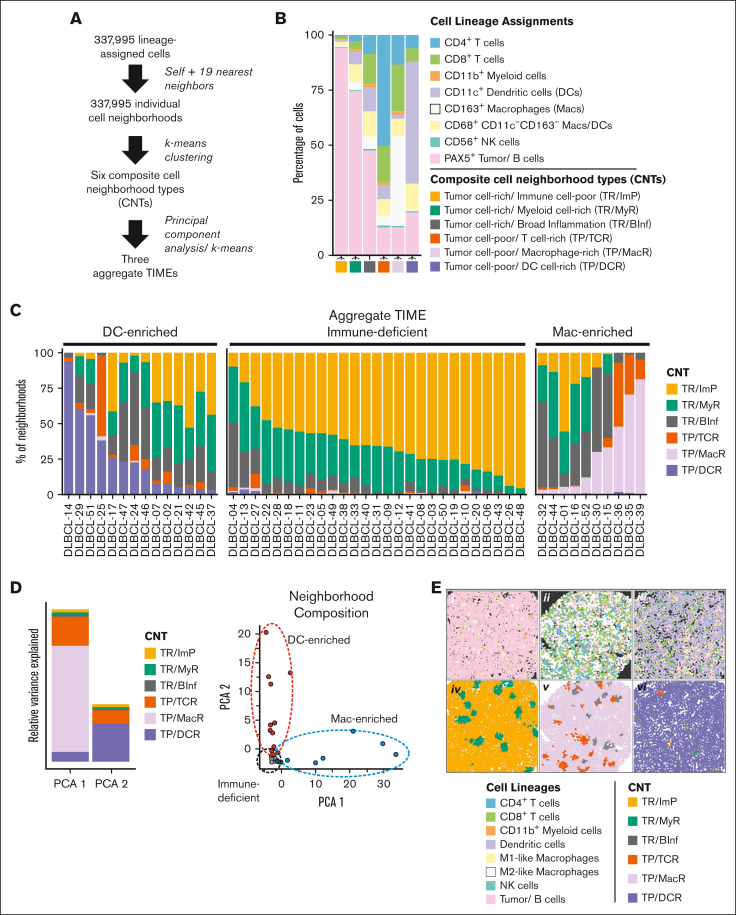
Figure 2.
Tumor and immune cells are organized into 6 composite CNTs that define 3 aggregate TIMEs. (A) Schematic flow of deriving 6 composite CNTs and their organization into 3 aggregate TIMEs. In brief, the lineage of each cell (self) and its 19 nearest neighbors was determined and defined as an individual cell neighborhood. The individual cell neighborhoods for all FOVs and cases (N = 337 995) underwent k-means clustering to arrive at 6 CNTs (supplemental Materials). Each cell was assigned to the best corresponding CNT based on the similarity of its cell neighborhood composition to each of the 6 CNTs. Cases, defined by their composite CNTs, were divided into 3 aggregate TIMEs distinguished by their unique CNT compositions, as determined by k-means clustering (supplemental Figure 3). (B) The mean compositions of each of the 6 indicated CNTs by cell lineages. (C) The percentage of total individual cell neighborhoods (1 neighborhood per cell) assigned to each of the 6 indicated CNTs by case. The data shown are summed from all FOVs. Data for individual FOVs are shown in supplemental Figure 2B. Cases were assigned to individual TIME categories according to the differential representation of cells in TP/DCR and TP/MacR neighborhoods after a k-means clustering analysis (supplemental Figure 3A). The k-means results were consistent with an assignment of cases with >3% of cells in TP/DCR neighborhoods as DC-enriched, cases with ≤3% of cells in both TP/DCR and TP/MacR neighborhoods as immune-deficient, and cases with >3% of cells in TP/MacR neighborhoods as Mac-enriched. In no case were >3% of cells in TP/DCR and TP/MacR neighborhoods (supplemental Figure 3B). (D) PCA of cases defined by aggregate CNT composition and showing that TP/MacR neighborhoods (in PCA 1) and TP/DCR neighborhoods (in PCA 2) are top contributors to the variance between cases and identify 3 aggregate TIMEs (red = DC-enriched, gray = immune-deficient, and blue = Mac-enriched; further details are presented in supplemental Methods). (E) Representative cell lineage maps (i, ii, iii) and their corresponding CNT maps (iv, v, vi, respectively) of select FOVs from cases in which most, but not all, cells reside in TR/ImP neighborhoods (DLBCL-22 with an immune-deficient TIME [i, iv]), TP/MacR neighborhoods (DLBCL-39 with a Mac-enriched TIME [ii, v]), and TP/DCR neighborhoods (DLBCL-14 with a DC-enriched TIME [iii, vi]). Note that CNT maps capture local cell heterogeneity within each TIME while maintaining spatial information. Additional comparisons are given in supplemental Figures 4-7.

