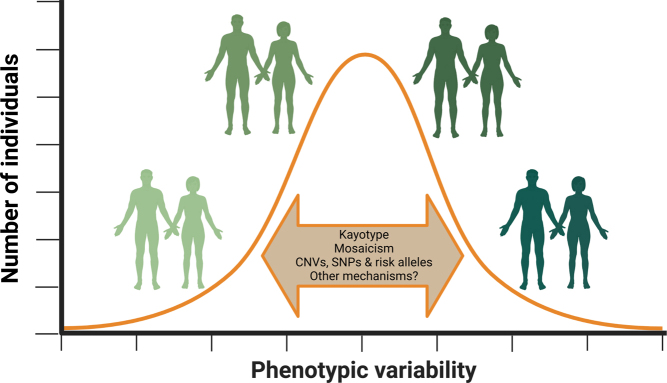
Figure 2.
SCAs are associated with several clinical phenotypic traits that show a huge range of inter-individual variation, even in subjects with the same karyotype. Several genetic modifiers (e.g. mosaicism, copy number variations (CNVs), and single-nucleotide polymorphisms (SNPs)) have been suggested to be implicated in the inter-individual variation seen. Thus, many of the phenotypic traits seen in SCAs may be seen as a spectrum following a normal distribution curve, like that of the general population, only shifted to the left (e.g. intelligence in KS) or right (e.g. height in KS), rather than a binary classification. This figure was created with BioRender.com.

 This work is licensed under a