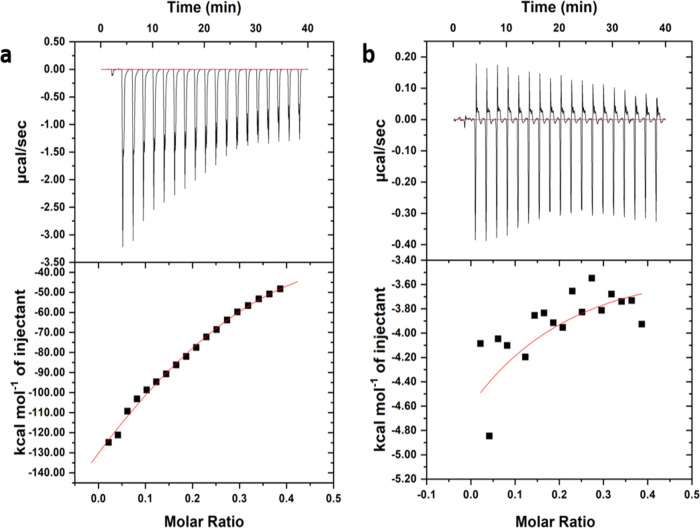
Figure 10.
ITC profile generated from the interaction between HRAS2 and HRAS1 IM DNA with morin. Upper panel shows the isothermal plot of morin and HRAS2 (a) and HRAS1 (b) IM DNA complex formation, and the lower panel represents the integrated binding isotherm generated from integration of the peak area as a function of the molar ratio. The solid line (red) represents the best fit data using the ‘one site binding model’.

