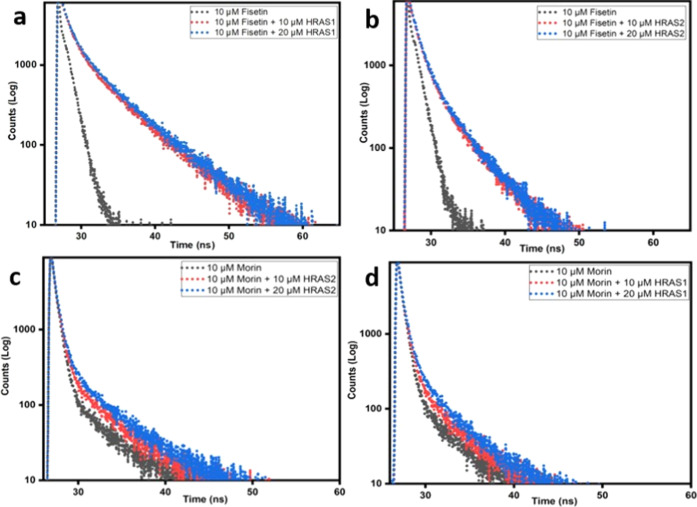
Figure 6.
Upper panel: time-resolved fluorescence decay profile of fisetin (10 μM, λex = 373 nm) in aqueous buffer and in the presence of HRAS1 (a) and HRAS2 (b) IM DNA (10 μM, 20 μM). (B) Lower panel: time-resolved fluorescence decay profile of morin (10 μM, λex = 373 nm) in aqueous buffer and in the presence of HRAS2 (c) and HRAS1 (d) IM DNA (10 μM, 20 μM).

